Search Console Data Sampling: What SEO Pros Must Know
SERPView Team
SEO Analytics

TL;DR:
Search Console data sampling filters and limits search query data, creating a gap between visible queries and total traffic. Most SEO professionals underestimate this sampling, which inflates anonymized traffic and affects trend analysis. Calibrating with the visible versus total gap helps measure sampling impact and improve analysis accuracy.
Search Console data sampling is the process by which Google filters and limits the search query data visible in your Google Search Console reports, returning only a representative subset rather than your site’s complete raw performance data. This happens because of privacy filtering, API row limits, and data aggregation rules that prioritize higher-traffic queries. The result is a reporting gap that most SEO professionals underestimate. Understanding how data sampling works in Search Console is the first step toward building analysis you can actually trust.
What is Search Console data sampling and why does it happen?
Google applies data sampling in Search Console through three distinct mechanisms: privacy filtering, API row limits, and URL canonicalization. Each one removes or merges data before you ever see it in a report.
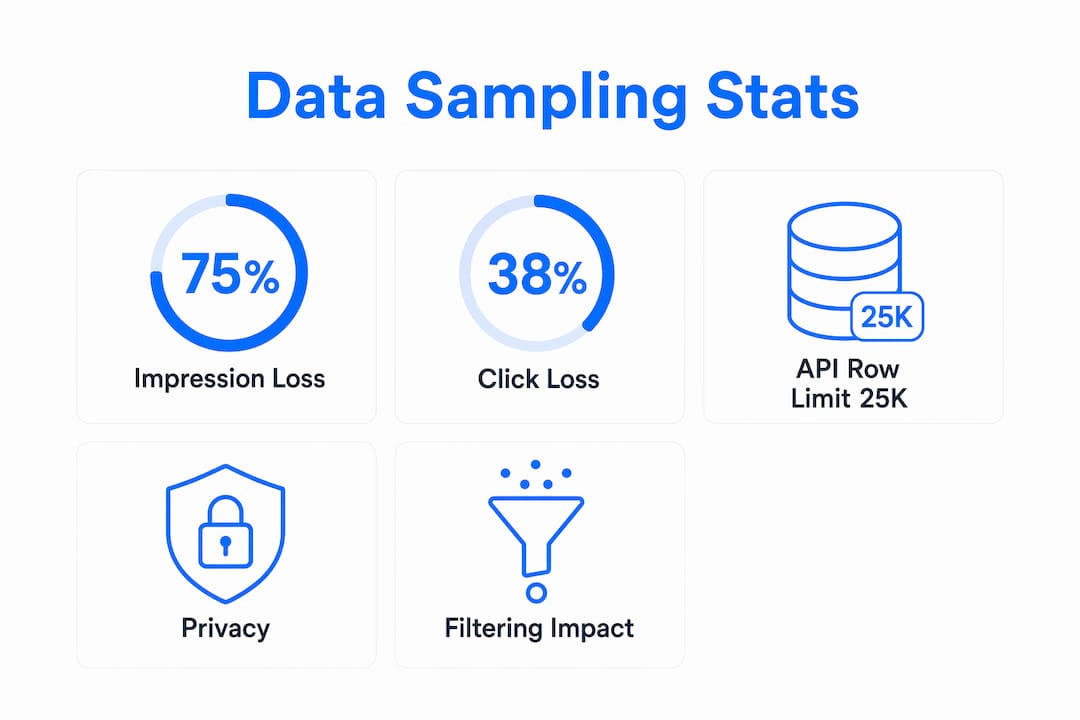
Privacy filtering is the most significant source of data loss. Privacy filtering hides roughly 75% of impressions and 38% of clicks at the query level, omitting low-volume or sensitive queries that could identify individual users. That means the majority of your impression data simply does not appear in the query table, even though Google counted it.
The Search Analytics API compounds this problem. The API caps results at a maximum number of rows per day per property and per search type, returning only the highest-click rows and truncating everything else. If your site generates more unique query combinations than the cap allows, the lower-traffic queries disappear from your export entirely.
URL canonicalization adds a third layer of distortion. Google groups URLs it treats as equivalent through canonical tags or redirects, merging their performance data. This makes page-level analysis unreliable when your site has redirect chains or multiple URL variants pointing to the same content.
Pro Tip: Always check the total clicks and impressions shown in the Performance chart before drawing conclusions from the query table. If the chart total is significantly higher than the sum of your query rows, you are looking at a sampled dataset.
How does data sampling distort your SEO reporting?
The most common symptom of data sampling is a mismatch between your total metrics and your visible query data. Total clicks and impressions in the Performance chart reflect all data including anonymized queries, while the query table only shows rows that pass both privacy thresholds and API row limits. This gap is not a bug. It is by design.
Here are the four most common distortions SEO professionals encounter:
-
Anonymous query inflation. Queries that Google anonymizes still contribute to your total click and impression counts. You see the traffic in the chart but cannot attribute it to specific keywords. This creates a blind spot in keyword discovery and content gap analysis.
-
Dimension expansion truncation. Adding dimensions like device, country, or page to your query multiplies the number of unique row combinations. More dimension filters cause higher unique row combinations, and exceeding API limits truncates data so sampling appears more pronounced. A query that shows up cleanly in a single-dimension report may vanish entirely when you add a second filter.
-
Reporting drift. Changing dimensions or frequent exports can unintentionally cause reports to sample different data subsets, complicating analysis consistency. If you run the same report twice with slightly different parameters, you may get different query lists. This is not a data error. It reflects which rows the API returned on each call.
-
Trend analysis gaps. When your visible query set changes from week to week due to sampling, trend lines for specific keywords become unreliable. A keyword that appears to drop in clicks may simply have been pushed out of the visible rows by a competing query gaining volume.
“Query tables reflect filtered subsets while chart totals reflect broader performance. Designing your reports to answer specific questions, rather than treating the query table as a complete dataset, is the only reliable approach to GSC analysis.” — Growth Memo
How to measure and calibrate the extent of data sampling
Calibrating your sampling rate gives you a concrete sense of how much data you are missing. The process is straightforward and does not require any paid tools.

| Method | What it measures | How to use it |
|---|---|---|
| Aggregate vs. query endpoint comparison | Proportion of data filtered by privacy rules | Pull totals without the query dimension, then pull with it. The gap is your filter rate. |
| Visible vs. total gap calculation | Combined effect of privacy filtering and API row limits | Divide query-level click sum by chart total clicks. A ratio below 0.5 signals heavy sampling. |
| Dimension lock testing | Reporting drift caused by changing parameters | Run the same export with identical dimensions daily. Track whether the query list shifts. |
| Date range expansion | Daily cap bypass | Aggregate over 30 or 90 days to surface more unique queries than any single day allows. |
The visible vs. total gap is the most practical calibration technique. Compute it by comparing your aggregate API endpoint data, pulled without the query dimension, against your query-level endpoint data. The difference tells you what proportion of your data is filtered out. Run this check monthly so you know whether your sampling rate is stable or worsening as your site grows.
Locking your dimension sets is equally important. Document every query parameter you use in your exports, including date range, search type, dimensions, and row limit. Any change to these parameters can shift which rows the API returns, making month-over-month comparisons meaningless.
Pro Tip: When building automated exports, set a fixed row limit and fixed dimensions in every API call. Throttle your exports to avoid hitting rate limits, which can cause the API to return inconsistent subsets on retry.
Practical ways to work around Search Console data sampling
No workaround eliminates sampling entirely, but several techniques reduce its impact on your analysis.
-
Aggregate over longer date ranges. Aggregating over weeks or months bypasses per-day row caps by summing multiple days of data. A 90-day export surfaces far more unique queries than 30 consecutive single-day exports combined.
-
Triangulate with additional data sources. Google Analytics 4, server-side log files, and third-party rank trackers each capture different slices of your search performance. Cross-referencing these sources helps you identify queries that GSC sampling hides. When GA4 shows organic sessions from a keyword that does not appear in your GSC query table, that is a sampling gap worth investigating.
-
Validate exports before analysis. Every time you pull a Search Analytics API export, compare the total clicks in the export against the chart total for the same date range. If the ratio drops below your established baseline, flag the export as heavily sampled before using it in a report.
-
Use extended storage tools. SEO tools like Serpview offer extended data storage and advanced visualization features that reduce the impact of Search Console sampling on SEO reporting. Serpview stores up to 50,000 rows and consolidates data across multiple properties, giving you a fuller picture than the native GSC interface provides.
-
Communicate sampling clearly in client reports. When presenting GSC data to clients or stakeholders, note the visible vs. total gap explicitly. A report that shows 500 queries driving 10,000 clicks, when the chart total shows 25,000 clicks, needs a clear explanation of why the numbers do not add up. Transparency here builds credibility rather than undermining it.
Understanding GSC data limitations before you build a reporting workflow saves significant rework later. The goal is not to fix sampling. The goal is to account for it consistently so your analysis stays reliable as your site scales.
Key Takeaways
Search Console data sampling means your query table always shows a filtered subset of your actual search performance, and the gap between visible data and total metrics is the most reliable indicator of how much you are missing.
| Point | Details |
|---|---|
| Privacy filtering is the largest gap | Google hides roughly 75% of impressions at the query level due to privacy rules. |
| API row limits compound the problem | The Search Analytics API returns only the highest-click rows, truncating lower-traffic queries. |
| Dimension expansion worsens sampling | Adding device, country, or page filters multiplies row combinations and increases truncation. |
| Calibrate with the visible vs. total gap | Divide query-level click totals by chart totals monthly to track your sampling rate over time. |
| Aggregate date ranges to recover data | Pulling 90-day exports surfaces more unique queries than any single-day API call allows. |
Why most SEO analysts are reading their GSC data wrong
I have reviewed hundreds of SEO reports over the years, and the same mistake appears constantly. Analysts treat the query table as a complete inventory of how their site ranks. They build content strategies, track keyword trends, and report wins and losses based on a dataset that, in many cases, reflects less than half of actual search activity.
The uncomfortable truth is that query-level data can materially understate actual site search performance, which requires calibration and alternative data methods. Most practitioners skip the calibration step entirely. They pull a GSC export, sort by clicks, and call it keyword research. That approach works well enough for high-traffic queries. For anything below a certain volume threshold, you are working with a map that has large sections missing.
The analysts who get this right treat GSC query data as a signal, not a census. They use the chart totals as their ground truth and treat the query table as a sample of what is driving that traffic. They cross-reference with log files and rank trackers to fill the gaps. They document their dimension configurations so their reports stay consistent month over month.
The competitive advantage here is real. When your competitors are making content decisions based on incomplete query data and you are calibrating for sampling, you are working from a more accurate picture of the same search landscape. That difference compounds over time, especially on large sites where the sampling gap grows as query volume increases.
Serpview’s query counting by ranking tier feature is one of the few tools that makes this calibration practical at scale. Monitoring sampling effects as your site grows is not optional. It is the difference between reporting that reflects reality and reporting that reflects Google’s filtered view of it.
— Utsav
How Serpview helps you see beyond sampling limits
Serpview is built specifically for SEO professionals who need more than what Google Search Console shows natively.
The platform consolidates data across multiple properties into a single dashboard, stores up to 50,000 rows, and provides extended historical tracking that goes well beyond GSC’s default window. Where the native interface truncates your query table and hides anonymized traffic, Serpview surfaces patterns across your full dataset. Features like query pattern analysis and customizable filters let you segment performance by device, country, and page without the truncation that hits the standard API. For SEO teams that report to clients or stakeholders, the shared dashboard feature makes it easy to present data with full context around sampling gaps. You can learn more about how Google Search Console works and where its limits lie in the Serpview GSC glossary.
FAQ
What is data sampling in Google Search Console?
Data sampling in Google Search Console is the process of filtering and limiting visible search query data due to privacy rules and API row caps. The result is that your query table shows only a subset of the queries actually driving traffic to your site.
Why do my total clicks not match my query row totals?
Total clicks in the Performance chart include anonymized queries that never appear in the query table. Totals reflect all clicks including anonymous queries, while query tables exclude low-volume or private queries that fail privacy thresholds.
How many rows does the Search Console API return?
The Search Analytics API caps results at a maximum number of rows per day per property and search type, returning only the highest-click rows. Aggregating data over longer date ranges is the most effective way to surface more unique queries.
Does adding more filters make sampling worse?
Yes. Adding dimensions like device or country increases the number of unique row combinations, which causes more rows to be dropped when the total exceeds the API limit. Use the minimum dimensions necessary for your specific analysis question.
How do I calculate my GSC sampling rate?
Divide the sum of clicks in your query table by the total clicks shown in the Performance chart for the same date range. A ratio significantly below 1.0 indicates heavy sampling. Running this check monthly helps you track whether your sampling rate is stable or increasing as your site scales.
Recommended
Ready to unlock your full GSC potential?
SERPView helps you access all your Google Search Console data without limitations. Start your free trial today.
Get Started Free