
Search Console + Looker Studio for SEOs: Connect and Report
SERPView Team
SEO Analytics
Yes, you can connect Google Search Console directly to Looker Studio using Google’s native connector, which pulls Search Console metrics into live, automated dashboards. At connection time, you choose either Site Impression or URL Impression, and one data source can only run one of those aggregations. Use Looker Studio for automated dashboards and multi-platform blending. Use native Search Console when you need URL inspection or technical debugging. Use SERPView when you need more than a few months of history or more than 1,000 rows.
Key Takeaways
Connecting Search Console to Looker Studio automates reporting, but native GSC and a tool like SERPView still handle the jobs the connector can’t.
| Point | Details |
|---|---|
| Pick one aggregation | Choose Site Impression or URL Impression at connection; a single data source can’t mix both. |
| Watch the search type mapping | URL Impression supports discover and googleNews; Site Impression does not. |
| Expect masked queries | Low-volume and sensitive queries appear blank due to privacy filtering, not a connector error. |
| Know the 16-month ceiling | Search Console’s data window caps year-over-year trend analysis at 16 months. |
| Scale beyond native limits | SERPView extends row exports to 50,000 and retains history longer for multi-property reporting. |
Table of Contents
- How Do You Connect Search Console to Looker Studio?
- Site Impression vs. URL Impression: Which Table Should You Use?
- What Charts Belong in a Search Console Dashboard?
- What Are the Limits of Search Console Data in Looker Studio?
- How Do You Scale Reporting Across Multiple Properties?
- How Practitioners Actually Split Their Workflow
- When Native Tools Aren’t Enough: What SERPView Adds
- Where to Go Next for Setup Help
- Sources
- FAQ
How Do You Connect Search Console to Looker Studio?
Getting your first Search Console dashboard running takes less time than most SEOs expect. Here’s the fastest path:
- Open Looker Studio, start a new report, and click Add data.
- Search for and select the Google Search Console connector.
- Authorize the connection with your Google account. Pick the verified property you want to report on. A domain property is worth setting up first because it automatically rolls in every protocol and subdomain variant.
- Choose your table: Site Impression or URL Impression.
- Set the default Search type, then click CONNECT.
- Once the report editor opens, add a date range control and at least one filter (branded query exclusion is a common first one).
Most connection failures trace back to permissions, not the connector itself. If a teammate can’t refresh the report, it’s usually because the data source credential is set to “Viewer’s,” meaning the report depends on that specific person staying logged in and verified. Agencies running dashboards for clients typically switch this to Owner’s credentials instead, so the report keeps refreshing even if the original editor leaves the account or loses access.
Pro Tip: Before you touch the visualization side, confirm your Search Console property status is “verified” and not “pending.” Reports built on pending properties will silently show zero data, and that’s a frustrating thing to debug an hour into building charts.

Site Impression vs. URL Impression: Which Table Should You Use?
This choice determines what your entire dashboard can and can’t show you, and you can’t mix both in one data source.
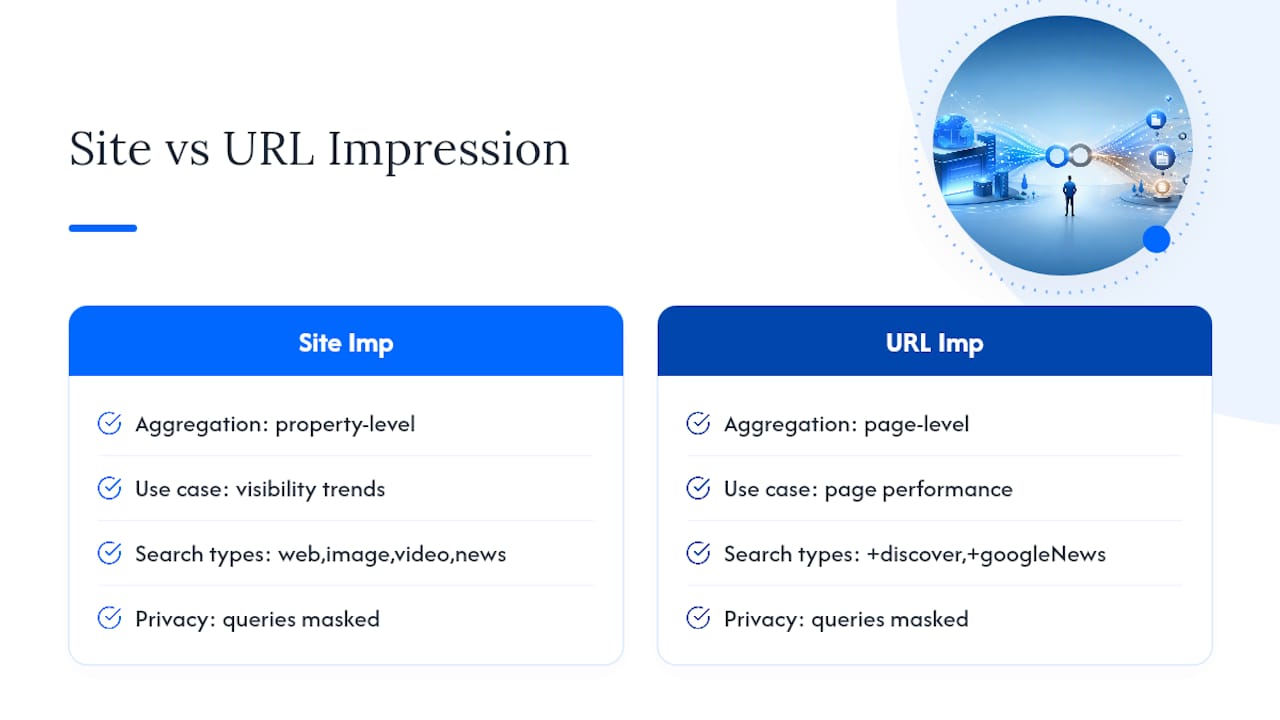
Site Impression aggregates data at the property level. It’s the better default for tracking overall visibility trends, branded versus non-branded splits, and country or device breakdowns across your whole domain.
URL Impression aggregates by individual page. Choose this when the dashboard’s job is to answer “which pages are winning or losing clicks,” like content decay tracking or landing page performance reviews.
The two tables also support different search types. Site Impression covers web, image, video, and news. URL Impression adds two more: discover and googleNews, per Google’s connector documentation. You can expose a Search type parameter as a drop-down so viewers can toggle between them without editing the report themselves.
One caveat that trips people up: Search Console masks or blanks queries with very low volume or that contain personal or sensitive terms, and that privacy filtering carries straight through to Looker Studio. Your query-level charts will show fewer rows than your total impressions suggest, and that’s expected behavior, not a connector bug.
Pro Tip: Start every new dashboard with a domain property in Search Console rather than a URL-prefix property. It saves you from building separate reports for http, https, and www variants later.
What Charts Belong in a Search Console Dashboard?
A handful of visualizations answer almost every question stakeholders ask. Build around these first:
- Time series for clicks and impressions — shows whether visibility is trending up, flat, or declining over the selected window.
- CTR by query or page — flags where a title tag or meta description needs work, since high impressions with low CTR usually means the snippet isn’t earning the click.
- Average position by query — tracks ranking movement for priority terms without manually checking the SERP.
- Top landing pages by clicks — surfaces which URLs actually carry your organic traffic.
- Device and country breakdowns — separates mobile from desktop performance and flags geographic gaps.
You don’t have to build every chart from scratch. Template galleries, including Supermetrics’ Search Console template, give you a working starting layout you can copy and restyle. Connecting through templates also removes the manual CSV export habit a lot of SEOs never quite broke, since the dashboard refreshes automatically instead. Just make sure you swap in your own brand-term filters and date ranges before sharing it externally. A template built for someone else’s site rarely fits yours out of the box.
What Are the Limits of Search Console Data in Looker Studio?
Before you hand a dashboard to a client or your boss, know what it can’t tell you.
- Low-volume and sensitive queries get masked or blanked, so query-level charts will always undercount total search terms.
- Search Console’s data window is capped at 16 months, which limits year-over-year comparisons once a site has been tracked that long.
- The connector has no access to URL Inspection, Index Coverage, or manual action data. Those live only in native Search Console.
That last point matters more than most guides admit. Looker Studio is genuinely excellent as a monitoring and alerting layer, the place you notice a traffic drop or a CTR dip. But when something looks wrong, you still have to go into native Search Console to find out why. A dip in impressions could mean a deindexing issue, a manual action, or a template rendering bug, and none of those show up in a Looker Studio chart.
A few operational habits keep dashboards reliable at scale:
- Build off domain properties, not URL-prefix ones, so protocol and subdomain changes don’t fragment your data.
- Set data source credentials to Owner-level for any dashboard more than one person touches.
- Avoid high-cardinality joins (blending query-level data with another large dataset) since they slow report load times noticeably.
- If your reporting needs longer retention than 16 months or more rows than Search Console exposes per query, that’s exactly the gap a dedicated Search Console alternative is built to close.
Pro Tip: If a report feels sluggish, check whether you’re blending two large data sources on a query-level join. Pre-aggregating one side, or dropping to Site Impression where page-level detail isn’t needed, usually fixes load times.
How Do You Scale Reporting Across Multiple Properties?
Once you’re managing more than one client or property, a few advanced moves separate a usable dashboard from a genuinely good one.
- Build a calculated field that flags branded versus non-branded queries using a regex match on your brand terms, so you can segment performance without manually filtering every chart.
- Blend Search Console with GA4 or Google Ads when a stakeholder needs to connect organic clicks to on-site conversions, not just impressions.
- For history beyond 16 months or row counts past what Search Console exposes, export to a warehouse like BigQuery, or use a third-party platform built for extended retention.
- Keep color coding and page layout consistent across every client report. It sounds cosmetic, but it’s what makes a multi-property portfolio feel like one product instead of ten different spreadsheets.
How Practitioners Actually Split Their Workflow
In practice, most experienced SEOs treat Looker Studio as the monitoring layer: check the dashboard weekly, catch anomalies early, then drop into native Search Console the moment something needs root-cause investigation. Client reporting runs almost entirely through shared Looker Studio links, since nobody wants to walk a client through the native GSC interface every month.
When Native Tools Aren’t Enough: What SERPView Adds
Search Console and Looker Studio cover a lot of ground, but both share the same ceiling: limited row counts and a 16-month data window. That becomes a real problem the moment you’re managing several properties or trying to prove a two-year ranking trend to a client. SERPView was built for exactly that gap.

It consolidates Search Console data across multiple properties in one dashboard, exports up to 50,000 rows instead of the usual 1,000-row cap, and keeps historical performance data far longer than native retention allows. Agencies get white-label sharing and team invitations built in, so client-ready reports don’t require rebuilding a Looker Studio template from scratch every time. If your reporting needs have outgrown what the free tools can hold, it’s worth seeing what a wider data ceiling actually looks like in practice.
Where to Go Next for Setup Help
For deeper configuration details, start with Google’s own connector documentation and the Search Console setup guide. For debugging guidance, review Search Central’s monitoring documentation.
Sources
- Connect to Search Console | Data Studio
- Google Search Console
- Connect to Search Console | Data Studio | Google Cloud Documentation
- How To Use Search Console | Google Search Central | Documentation | Google for Developers
FAQ
How do I check Search Console for a site?
Log into Google Search Console with the Google account tied to your verified property, then review the Performance, Coverage, and URL Inspection reports directly in the native interface.
How do I set up Search Console for the first time?
Verify site ownership through a domain property, HTML tag, or DNS record, then wait for data to begin populating in the Performance report.
What is Google Search Console used for?
It’s a free tool for monitoring how your site appears in Google Search, tracking clicks, impressions, average position, and diagnosing indexing or technical issues.
Does Looker Studio still exist?
Yes. Looker Studio (formerly Google Data Studio) is an active Google product that continues to support the Search Console connector and cross-source data blending.
When should I use SERPView instead of Looker Studio alone?
Once you need more than 1,000 rows of query data, longer than 16 months of history, or a single dashboard across multiple client properties, SERPView fills the gaps native Search Console and Looker Studio leave open.
Recommended
Ready to unlock your full GSC potential?
SERPView helps you access all your Google Search Console data without limitations. Start your free trial today.
Get Started Free