Correlate Search Trends with Campaign Performance
SERPView Team
SEO Analytics
TL;DR:
- Mapping search trends to campaign metrics uncovers net-new demand that attribution models often miss.
- Performing lift studies and monitoring real-time search velocity helps marketers measure true incremental impact and optimize budget timing.
Correlating search trends with campaign performance means mapping normalized search interest scores against campaign metrics like ROAS, CPL, and CPC to uncover net-new demand your attribution model never captures. The standard industry term for this practice is search lift analysis, and it goes well beyond checking whether clicks went up after a campaign launched. Google Trends expresses interest on a 0–100 normalized scale relative to peak interest within a selected timeframe and region. That score is a momentum signal, not an absolute volume count. When you align those signals with your campaign timeline, you get a defensible picture of incremental impact rather than a vanity metric summary.
How to correlate search trends with campaign performance
Correlating search trends with campaign performance starts with understanding what each data type actually measures. Relative search interest scores show demand momentum. Campaign metrics like ROAS, CPL, and branded search volume show what your spend produced. Neither tells the full story alone.

The goal is to place both data streams on the same timeline and look for directional relationships. A spike in branded search volume that follows a paid social push, for example, signals a social halo effect. That lift represents conversions your last-click model never credited to the campaign.
| Data source | Metric type | What it measures |
|---|---|---|
| Google Trends | Relative interest (0–100) | Demand momentum and seasonal shifts |
| Google Ads | ROAS, CPC, CPL | Paid campaign efficiency |
| Google Search Console | Branded query volume, CTR | Organic search response to campaigns |
| CRM or analytics platform | Direct sessions, assisted conversions | Full-funnel attribution signals |
| Google Sheets integration | Combined time-series data | Cross-source correlation analysis |
Google Sheets is the most practical tool for combining these sources. You can pull Google Trends data via a Supermetrics connector and align it with exported campaign metrics in a single spreadsheet. That alignment is where the real analysis begins.
Pro Tip: When you export Google Trends data, always select the same geographic region and time window as your campaign. Mismatched settings produce scores that are not comparable across data pulls.
How do you establish baselines and align timelines?
A 4-week pre-campaign baseline is the minimum window needed to make lift measurable and defensible. Your baseline should capture branded search volume, direct sessions, and assisted conversion paths before any campaign activity begins. Without this anchor, you cannot separate organic demand from ad-driven demand.
Aligning your trend timeline with your campaign calendar requires attention to lag. Branded search volume often peaks 24–72 hours after a social amplification event and can stay elevated for weeks. That means a campaign that ran in the first week of a month may not show its full search impact until the second or third week. Plotting both curves on the same chart makes this lag visible.
Relative search interest functions as a leading indicator when you read it correctly. A rising score before your campaign peaks tells you demand is forming. A score that plateaus or drops during your campaign suggests you are spending into existing demand rather than generating new interest.
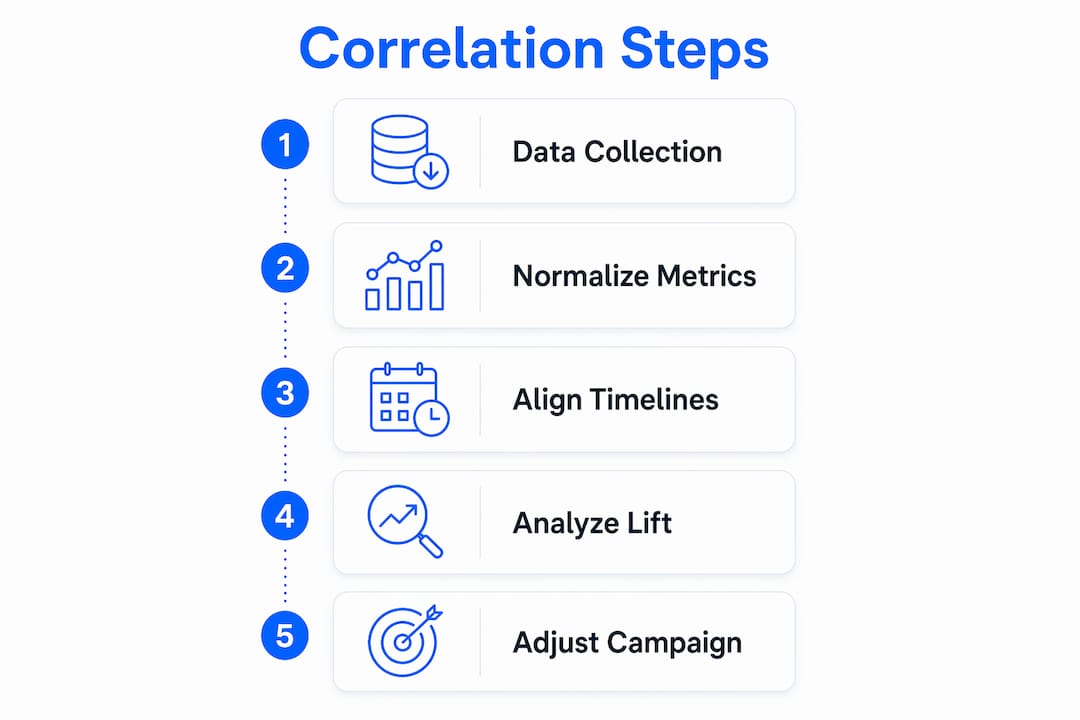
Key steps for timeline alignment:
- Pull 4 weeks of pre-campaign data for branded queries, direct sessions, and conversion paths
- Export campaign spend, impressions, and ROAS for the same period
- Add the campaign launch date as a vertical reference line in your chart
- Track the Google Trends score daily for the campaign duration
- Note the lag between spend peaks and branded search peaks
Pro Tip: Google Trends’ “Trending Now” feature updates every 10 minutes. Check it at campaign launch to catch early demand velocity before it shows up in your weekly reports.
How do lift studies and social halo analysis calculate incremental impact?
Traditional attribution models inflate credit for conversions that would have happened organically. Incremental lift communicates causal impact, not just correlation. This distinction matters when you are defending budget decisions to a stakeholder who only sees last-click ROAS.
Google Ads Lift Studies isolate true incremental impact by comparing an exposed audience group against a holdout control group. The relative lift formula is straightforward: divide the absolute increase in searches by the baseline search volume. A result of 50% or higher indicates the campaign generated meaningful net-new brand interest. Lift studies run over 28 days and require a minimum impression and search volume threshold to produce valid results.
The social halo effect works differently. It measures how paid social or display activity drives branded search queries that then convert through organic or direct channels. You track this by comparing branded query volume in Google Search Console against your baseline window, then attributing the delta to the campaign period.
Follow these steps to calculate incremental impact:
- Set your 4-week baseline window and record branded search volume, direct sessions, and assisted conversions
- Launch your campaign and record daily spend, impressions, and ROAS
- Export branded query data from Google Search Console for the campaign period
- Calculate the percentage increase in branded searches versus the baseline average
- Run a Google Ads Lift Study if your impression volume qualifies, using the relative lift formula
- Compare the lift study result against the branded search volume delta to cross-validate
- Attribute the incremental searches to the campaign as non-credited conversions
This process gives you a number you can defend. It also shows where your attribution model is undercounting campaign value, which is the argument most paid media teams need when requesting budget increases. For a deeper look at how search data supports paid campaigns, the relationship between organic lift and paid spend is worth examining in detail.
What advanced techniques improve correlation accuracy?
Trend velocity matters more than trend volume. Monthly aggregated data delays your response by weeks. Real-time velocity monitoring, using the 10-minute update cycle in Google Trends’ “Trending Now” engine, lets you identify early growth phases before competitors act. A score moving from 20 to 60 over three days signals a forming demand wave. Waiting for your weekly report means you enter that wave at its peak, paying the highest CPC for the least incremental return.
Predictive seasonal pacing takes this further. Analyzing 5-year trend curves lets you ramp budgets during the trend-forming phase rather than the peak phase. Ramping budget early avoids paying peak CPC when competition is highest, which produces significantly better ROAS outcomes.
AI-driven platforms add another layer. AI models synthesize signals across seasonality, market events, and campaign data simultaneously, identifying correlations that manual dashboards miss. These platforms analyze patterns across thousands of accounts to prioritize which correlations actually drive optimization impact. For eCommerce marketers, AI-enabled search synthesis connects shopper intent signals directly to campaign adjustments in near real time.
Key techniques for advanced correlation:
- Monitor “Trending Now” at campaign launch and at 48-hour intervals
- Build 5-year seasonal trend curves for your top branded and category keywords
- Use AI-assisted platforms to flag cross-channel correlation signals your team would miss manually
- Integrate search analytics ROI data into your campaign reporting cadence
Pro Tip: Feed your AI platform’s correlation output directly into your weekly campaign review. Label each insight with the trend signal that triggered it. This creates an audit trail that improves your model over time.
Key Takeaways
Correlating search trends with campaign performance requires baseline windows, lift studies, and real-time velocity monitoring to isolate true incremental demand from organic noise.
| Point | Details |
|---|---|
| Normalize your data sources | Align Google Trends scores and campaign metrics on the same timeline before drawing conclusions. |
| Set a 4-week baseline | Record branded search volume and direct sessions before launch to make lift measurable. |
| Use lift studies for proof | Google Ads Lift Studies calculate relative lift to isolate ad-driven demand from organic conversions. |
| Monitor trend velocity | Check “Trending Now” every 48 hours to catch demand waves before they peak and CPC rises. |
| Apply AI for cross-channel signals | AI platforms identify correlations across seasonality and campaign data that manual analysis misses. |
Why most marketers measure this backward
I have reviewed campaign reports from dozens of marketing teams, and the pattern is consistent. They pull last month’s search volume, compare it to last month’s ROAS, and call it trend analysis. That is rearview mirror management. By the time monthly data confirms a trend, the opportunity has already closed.
The teams that actually improve campaign efficiency focus on two things I rarely see in standard reporting. First, they track incremental searches per impression rather than total clicks. Total clicks include people who were already going to convert. Incremental searches represent net-new demand your campaign created. That distinction changes how you evaluate every campaign you run.
Second, they treat branded search volume as a campaign output metric, not just an organic SEO number. When a paid social campaign drives a 30% spike in branded queries, that spike represents real purchase intent. Ignoring it because it shows up in Google Search Console rather than Google Ads is how teams systematically undervalue their own work.
The uncomfortable truth is that most attribution models are built to confirm spend rather than measure it. Lift studies and social halo analysis exist precisely because standard models cannot answer the question that actually matters: would these conversions have happened without the campaign? Until you answer that question, you are optimizing for credit, not for impact.
— Utsav Chopra
How Serpview helps you track search and campaign data together
Serpview gives digital marketers a unified view of search performance data that standard tools fragment across multiple dashboards. Its consolidated analytics pull up to 50,000 rows of query data, far beyond the 1,000-row limit that cuts off most standard search console exports.
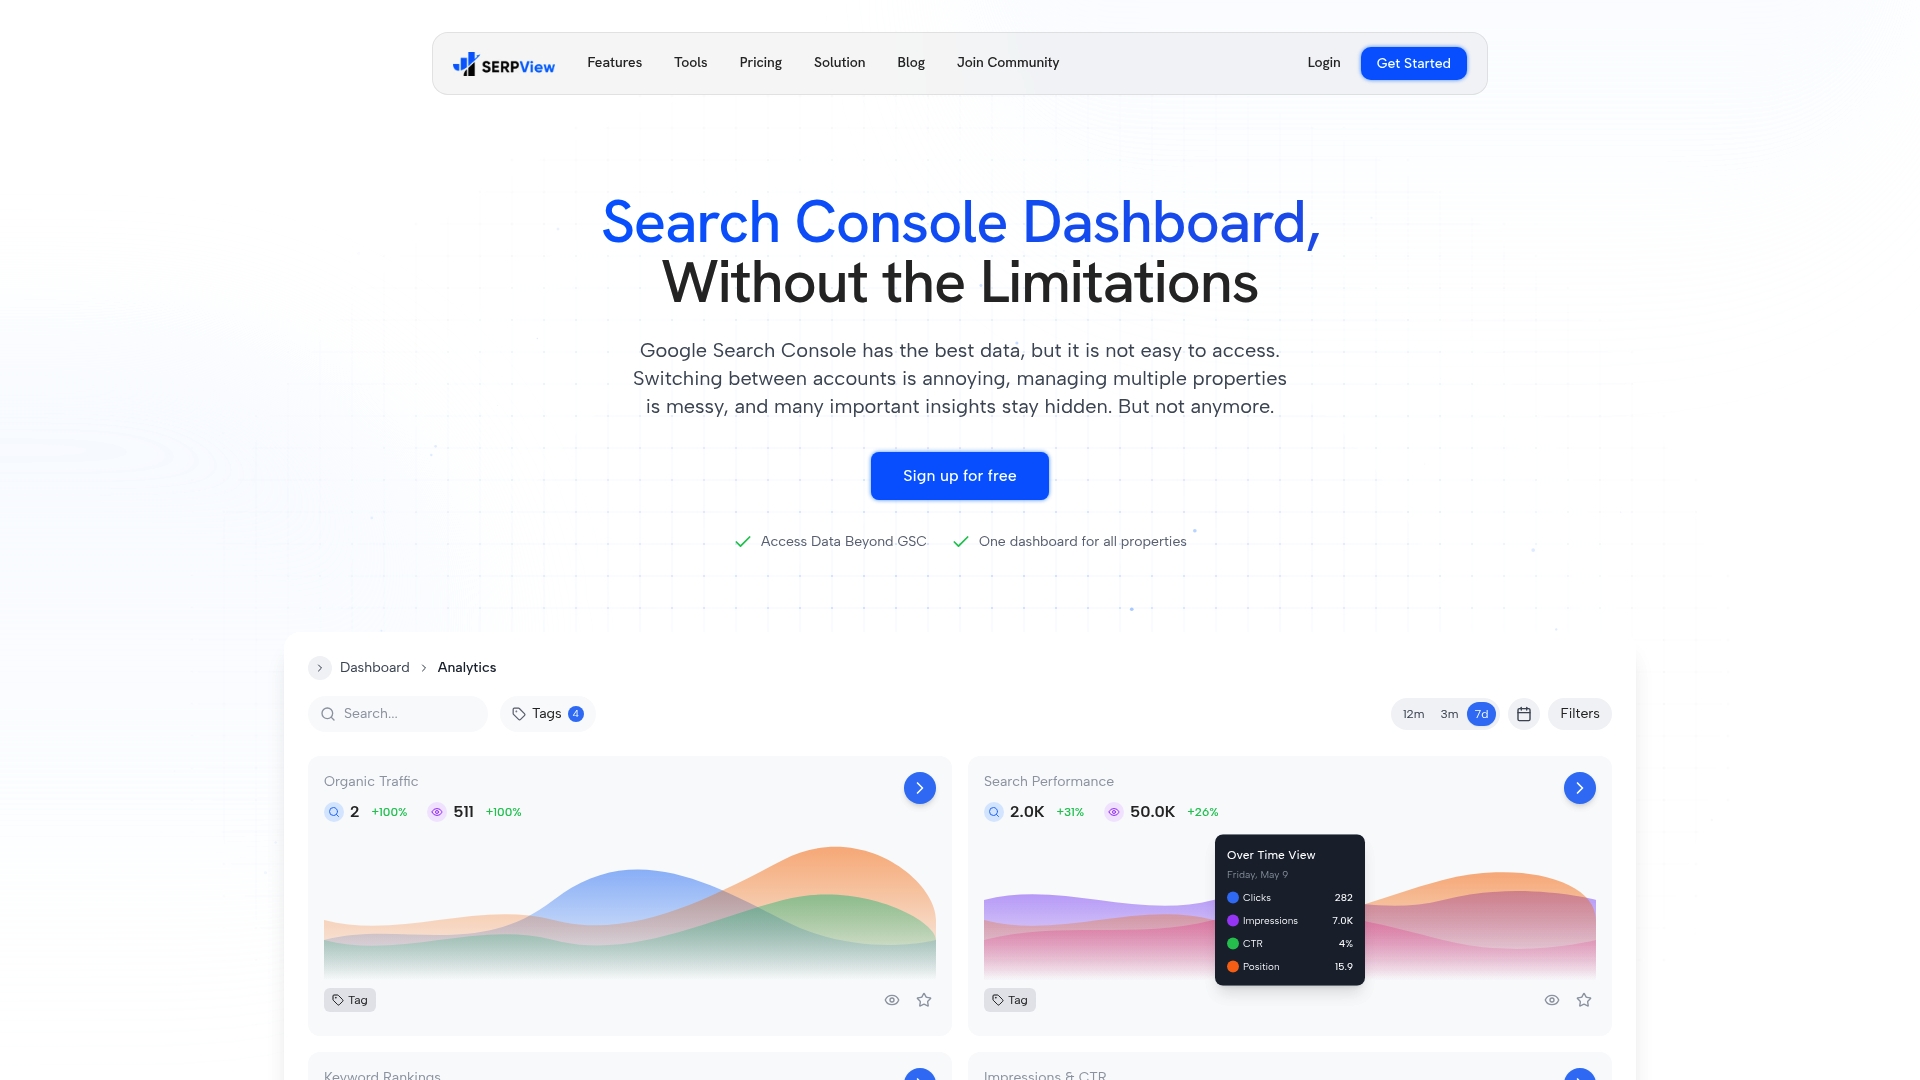
When you are running lift analysis or tracking branded query volume against a campaign baseline, Serpview’s customizable filters let you isolate exactly the keyword segments and date ranges you need. The Google Search Console glossary on Serpview explains how to read click-through rate and query data in the context of campaign analysis. Serpview’s real-time updates mean you are not waiting for weekly data exports to see whether branded search volume is responding to your current campaign. That speed is what separates reactive reporting from proactive optimization.
FAQ
What does it mean to correlate search trends with campaign performance?
It means aligning normalized search interest scores from tools like Google Trends with campaign metrics like ROAS and CPL on the same timeline to identify whether your campaigns are generating net-new demand. The standard analytical method for this is search lift analysis.
How long should a baseline window be before a campaign?
A 4-week pre-campaign baseline is the standard minimum. It should include branded search volume, direct sessions, and assisted conversion paths to give you a defensible reference point for measuring lift.
What is relative lift in a Google Ads Lift Study?
Relative lift equals the absolute increase in searches divided by the baseline search volume. A result of 50% or higher indicates the campaign generated meaningful new brand interest beyond what would have occurred organically.
Why does trend velocity matter more than trend volume?
Monthly aggregated search volume data arrives weeks after demand has already peaked. Real-time velocity monitoring, using Google Trends’ 10-minute update cycle, lets you identify forming demand waves and adjust budgets before CPC rises at peak.
How does the social halo effect connect to campaign performance metrics?
The social halo effect describes how paid social or display campaigns drive branded search queries that convert through organic or direct channels. Branded search volume typically peaks 24–72 hours after a social amplification event, and tracking that lift against your baseline reveals conversions your last-click model never attributed to the campaign.
Recommended
Ready to unlock your full GSC potential?
SERPView helps you access all your Google Search Console data without limitations. Start your free trial today.
Get Started Free