
Why Unified Analytics Reduces Reporting Time for Agencies
SERPView Team
SEO Analytics
TL;DR:
- Unified SEO analytics automate data collection, eliminate manual report building, and save agencies hours each week.
- Implementing a consolidated pipeline streamlines data pulls, standardizes schemas, and delivers client-ready reports with minimal effort.
Unified SEO analytics cuts reporting time by eliminating repetitive manual exports, automatically reconciling data across properties, and delivering templated outputs your team can send without last-minute assembly. For agencies managing dozens of sites, SEO managers spend significant time each month hand-building reports by pulling from Google Search Console, GA4, rank trackers, and backlink tools, then stitching everything together in spreadsheets. Consolidating those sources into a single dashboard removes that loop entirely.
Time saved: Agencies report saving several hours per week per domain after automating rank checks and report assembly — hours that shift from data wrangling to client strategy.
Table of Contents
- Why unified analytics reduces reporting time: the core mechanisms
- How much time can your agency realistically save?
- How to implement unified analytics: a step-by-step checklist
- What client-ready reporting workflows actually look like
- Common concerns about centralized reporting and how to address them
- How Serpview reduces reporting time in practice
- Quick ROI formula for your agency
- Key Takeaways
- The shift nobody talks about when you automate reporting
- Serpview puts this guide into practice
- Sources and further reading
- FAQ
Why unified analytics reduces reporting time: the core mechanisms
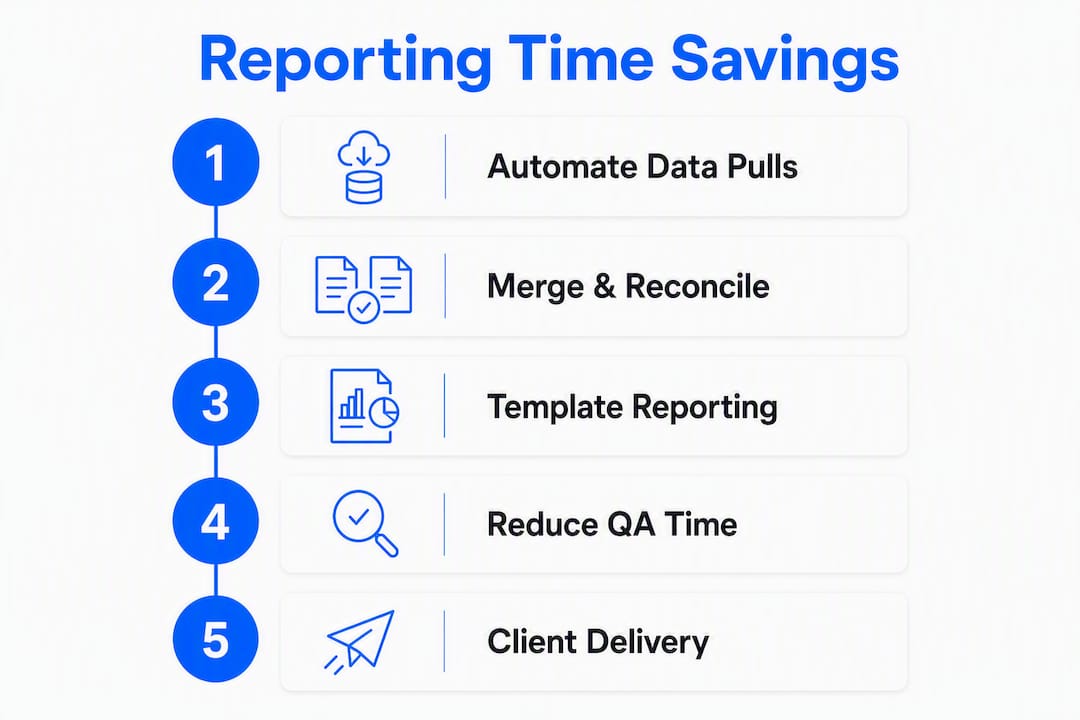
The time savings come from five specific operations that a unified stack handles automatically, replacing tasks your team currently does by hand.
- Scheduled data pulls. Instead of logging into each GSC property weekly, a pipeline pulls data on a set cadence. A GSC-to-BigQuery export automates daily incremental updates and preserves historical data beyond GSC’s native 16-month rolling window.
- Deduplication and aggregation. When you pull multiple properties into one schema, the pipeline deduplicates overlapping date ranges and aggregates metrics consistently. No more copy-pasting rows between tabs.
- Standardized schema. A fixed field structure means every property’s data lands in the same format. Report templates built on that schema work for every client without modification.
- Templated exports. Pre-built report layouts populate automatically when new data arrives. An audit across multiple retainers found average monthly reporting build time dropped significantly after moving to a modern stack.
- Anomaly alerts. Automated threshold alerts flag traffic drops or CTR shifts before your team notices them manually, so you respond faster and brief clients proactively.
GSC’s multi-dimension queries suppress rows when combinations fall below anonymization thresholds. A unified pipeline handles this by pulling aggregate totals separately from row-level exports, so your consolidated sums match what the GSC UI shows rather than undercounting anonymized queries.
Pro Tip: Always report aggregate totals to clients rather than summing exported rows. The two figures can differ because anonymized queries are excluded from row-level exports but included in aggregate totals — a discrepancy that erodes client trust if left unexplained.
How much time can your agency realistically save?
The honest answer depends on your current process, but the range is wide enough to justify the math. Manual reporting commonly consumes multiple hours per week per domain in exports and merges. Automation compresses that to a QA check and a narrative.

| Agency size | Sites managed | Conservative hours saved/month | Optimistic hours saved/month |
|---|---|---|---|
| Small | 5 sites | 8 hrs | 20 hrs |
| Mid-size | 20 sites | 60 hrs | 80 hrs |
Assumptions: Conservative scenario uses 1.5 hrs/site/month (export + merge + QA). Optimistic uses 4 hrs/site/month (export + merge + QA + report assembly). Both scenarios assume automation reduces that time to a 15-minute QA check per site. Centralized reporting for agencies managing 20+ sites eliminates per-site logins and exports, which is where most of the time disappears.
Industry benchmark: For a 10-client agency, manual reporting can consume 30–40 hours per month on a deliverable that produces no new client value — clients already know they ranked; they want to know what’s next.
How to implement unified analytics: a step-by-step checklist
Done correctly, a unified rollout produces daily scheduled pulls, a consistent schema, and client-ready reports within 30 days. Here is the ordered checklist.
- Enable GSC API access or BigQuery export for each property. Confirm OAuth scopes and verify that your GCP project has the Search Console API enabled.
- Centralize credentials and permissions. Use delegated GSC access rather than shared login credentials. Document which team member holds owner-level access per property and store tokens in a secrets manager.
- Define your schema and deduplication rules. Agree on date granularity (daily vs. weekly), dimension set (query, page, device, country), and how you handle overlapping date ranges when backfilling.
- Build or configure report templates. Map each template field to a schema column so templates auto-populate. Include an executive summary, keyword movers, and a work log section.
- Set anomaly alerts. Configure threshold alerts for week-over-week traffic drops, CTR changes above a set percentage, and index coverage errors.
- Run two internal test cycles. Pull data for a 30-day window, compare totals against the GSC UI, and resolve any discrepancies before any client sees the output.
- Plan the client rollout. Start with one clean, low-complexity client as a pilot. Schedule a brief walkthrough call to set expectations before switching their reporting over.
For the permissions step, consolidating search analytics properties requires careful scoping of GCP project access so that one client’s data is never visible to another. Treat each client’s GSC properties as a separate workspace.
Pro Tip: Pilot on your most organized client first — clean historical data, no legacy tracking issues, and a contact who will give honest feedback. The lessons from that pilot will save you hours when you roll out to the rest of your roster.
What client-ready reporting workflows actually look like
Choose a delivery model upfront: a scheduled assembled report plus an optional live dashboard. Automate the assembly; keep the narrative human.
- Monday morning briefing. An automated internal summary lands in your team’s inbox every Monday with week-over-week changes flagged. No one opens GSC manually to check.
- Monthly client PDF. The pipeline assembles a branded PDF from the template, populated with the latest data. A team member adds a 3–5 sentence narrative and sends it. Total time: under 20 minutes per client.
- Onboarding baseline report. When a new client connects, the system auto-populates 12 months of historical data into a baseline template so you start the engagement with context, not a blank slate.
- Ad-hoc investigation. When a client asks “why did traffic drop last Tuesday?”, you pull from the unified dashboard rather than re-exporting from three tools. The answer takes minutes, not an afternoon.
The handoff point where human analysis remains necessary is the narrative: what the numbers mean, what caused the change, and what action you recommend. Automation handles the data; you handle the judgment. For visual presentation guidance, how agencies present search data visually covers template design that makes consolidated reports readable in under 30 seconds.
Common concerns about centralized reporting and how to address them
The risks are real but manageable with QA, testing, and transparent reconciliation. Here are the objections you will hear and the mitigations that work.
GSC row limits and suppression. GSC’s default export caps at 1,000 rows per query. Pull aggregate totals for summary metrics and use paginated API calls for row-level data. Platforms that support up to 50,000 rows per export remove this ceiling for most agency use cases.
API quotas and rate limiting. GSC API has per-property daily quotas. Stagger your scheduled pulls across properties and implement exponential backoff in your pipeline to avoid quota errors during peak periods.
GSC vs. GA4 discrepancies. GSC counts impressions and clicks from Google Search; GA4 counts sessions and users from all sources. They will never match exactly. Document the difference in your reporting template so clients understand what each metric measures before they ask.
Client permission models. Delegated access means a client can revoke your GSC access at any time. Build a permission audit into your monthly QA checklist and notify clients before access changes affect their reports.
Pro Tip: Before your first client rollout, run a reconciliation meeting with one or two internal stakeholders using real data. Walk through every number, explain every discrepancy, and document the answers. That document becomes your QA runbook.
Note: GSC anonymizes queries below a certain impression threshold, which means row-level exports will always undercount total clicks slightly. Pull aggregate totals for client-facing summaries to avoid this gap.
How Serpview reduces reporting time in practice
Serpview consolidates GSC data across all your properties into a single dashboard, removing the per-property login and export loop that accounts for most manual reporting time.
- Tag-based combined analytics — group properties by client, region, or topic cluster and report on them as a single entity without merging spreadsheets.
- Shared dashboards — send clients a live, branded view of their data without building a separate Looker Studio report for each account.
Feature check: Serpview’s shared dashboard lets you white-label a live data view for each client, removing the need to export and reformat data before every client call.
Quick ROI formula for your agency
Monthly net benefit = (hours saved per client × hourly rate × number of clients) − monthly migration and tooling cost.
| Variable | Conservative | Optimistic |
|---|---|---|
| Hours saved per client/month | 2 hrs | 5 hrs |
| Clients on unified reporting | 10 | 20 |
| Monthly tooling cost | $150 | $150 |
Migration cost checklist: setup time (one-time, typically 8–16 hours), tooling subscription fees, and team training (plan for 2–3 hours per analyst). Spread setup time across the first three months when calculating net benefit.
Example calculation:
- Your agency manages 15 clients. Current manual reporting: 3 hrs/client/month = 45 hrs/month.
- After unification: 30-minute QA per client = 7.5 hrs/month.
- Hours reclaimed: 37.5 hrs/month × $80/hr = $3,000/month in recovered analyst capacity.
- Tooling cost: $150/month. Net benefit: $2,850/month.
For a deeper look at why measuring SEO performance matters for agency growth, the ROI case extends beyond time savings to client retention and upsell capacity.
Key Takeaways
Unified SEO analytics reduces reporting time by automating data pulls, reconciling GSC discrepancies, and delivering templated outputs so agencies reclaim hours previously lost to manual assembly.
| Point | Details |
|---|---|
| Core time savings | Automation cuts several hours per week per domain to a brief QA check. |
| GSC row limits | Platforms supporting many more rows remove the 1,000-row ceiling that forces manual workarounds. |
| ROI calculation | (Hours saved × hourly rate × clients) minus tooling cost gives your monthly net benefit. |
| Implementation order | Pilot on one clean client, run two QA cycles, then roll out to the full roster. |
| Serpview | Consolidates GSC across properties with tag-based analytics, shared dashboards, and 50,000-row exports. |
The shift nobody talks about when you automate reporting
Most conversations about unified analytics focus on hours saved. The more significant change is what your team does with those hours.
When report assembly is automated, the analyst’s job description quietly changes. The work shifts from pulling and formatting data to interpreting it and recommending action. That is a better use of skilled people, and clients notice. A client who receives a 3-sentence narrative explaining why their traffic dropped and what to do about it will stay longer than one who receives a 20-page data dump assembled manually.
The operational change is also worth naming honestly. Billing models built on hourly reporting labor become harder to justify when a machine does the assembly in minutes. Agencies that have made this transition tend to reprice toward retainers tied to outcomes rather than hours, which is a healthier commercial relationship anyway.
One practical note on rollout: plan a 90-minute call per client when you switch them to the new system. Clients will have questions about why numbers look slightly different, what the new dashboard shows, and how to read it. That call is not overhead — it is the moment you demonstrate that you understand their data better than they do.
Serpview puts this guide into practice
If you manage more than five client properties and still export GSC data manually each month, the time cost compounds faster than it feels. Serpview implements every recommendation in this guide: consolidated GSC data across all your properties, exports up to 50,000 rows, shared live dashboards for client-facing delivery, and custom annotations that overlay site changes directly onto your performance charts so context is built into every report.

Getting started takes less than a day. Connect your properties, pick a report template, and run your first consolidated export. Most teams complete a working pilot within a week. Serpview’s support team is available during onboarding to walk through permissions setup and template configuration. Start your trial at serpview.com and have your first unified report ready before your next client call.
Sources and further reading
The claims in this article draw on the following sources. Each link goes to the original material for deeper reading.
- SEO Analytics Reporting: 3-Tier Automation Playbook for 2026 — manual reporting time estimates for agencies (30–40 hrs/month for 10 clients).
- Automated SEO Reports: Stop Hand-Building Monthly Reports — 12–20 hours monthly spent on manual report assembly.
- GSC → BigQuery Pipeline | Sebastian Gade — automating daily incremental GSC exports and preserving historical data.
- Automate SEO Reporting and Weekly Rankings | LOW/CODE — 2–5 hours/week per domain in manual exports; ~3 hours/week saved by automation.
- SEO Reporting 2026: What Comes After Looker Studio — 14-retainer audit showing build time fell from 11 to 4 hours/month.
- SEO Reporting Dashboard for Agencies & Clients: Automate It — pipeline design: pull, compare, assemble, human review.
- Centralized SEO Reporting: Streamline Agency Data in 2026 — case for centralization at 20+ sites.
- Google Search Console: anonymized queries and data differences — why row sums differ from aggregate totals in GSC.
- Why Consolidate Search Analytics Properties in 2026 | Serpview Blog — rollout steps and rationale for consolidating GSC properties.
- Shared Dashboard | Serpview — product documentation for live client-sharing dashboards.
FAQ
Why does unified analytics reduce reporting time so significantly?
It removes the repetitive pull-merge-reconcile loop that typically consumes 12–20 hours monthly per analyst. Automated pipelines handle data collection and formatting; your team handles only the narrative.
What is GSC’s row limit and why does it matter for agencies?
Google Search Console exports a maximum of 1,000 rows per query by default, which truncates data for large sites. Platforms like Serpview support up to 50,000 rows, giving agencies complete data without manual workarounds.
How long does it take to implement a unified reporting setup?
Most agencies complete a working pilot within one week: one day to connect properties and configure permissions, a few days to build and test templates, and one QA cycle before the first client delivery.
Why do GSC and GA4 numbers never match exactly?
GSC measures impressions and clicks from Google Search specifically; GA4 measures sessions and users across all traffic sources. The two tools count different things, so a documented reconciliation note in your report template prevents client confusion.
Can Serpview consolidate data from multiple GSC properties in one view?
Yes. Serpview consolidates GSC data across all connected properties, supports tag-based grouping for combined analytics, and delivers shared dashboards so clients see a single, branded view of their performance.
Recommended
Ready to unlock your full GSC potential?
SERPView helps you access all your Google Search Console data without limitations. Start your free trial today.
Get Started Free