
CTR by Position: 2026 Benchmarks and a 7-Step Search Console Curve
SERPView Team
SEO Analytics
The action that matters most is simple. Push hard for the top two positions, and never read a benchmark without segmenting by SERP feature, device, and query type first.
TL;DR:
- Most clicks are concentrated on the top two positions, but actual CTR varies significantly depending on SERP feature presence and query type.
- AI Overviews and other features like featured snippets and local packs greatly reduce organic CTR, especially for informational and local searches.
- Mobile devices and high-intent, long-tail queries tend to outperform desktops and short queries at the same rank, influencing CTR benchmarks.
- Building personalized CTR curves using Search Console data is faster and more accurate than relying on generic industry benchmarks.
- Segmenting queries by AI presence, device, and brand status before analyzing CTR ensures more reliable insights for prioritization.
Table of Contents
- CTR by Position: What the Data Actually Shows
- How AI Overviews and Other SERP Features Change Your Clicks
- How Device and Search Intent Shift the CTR Curve
- How to Build Your Own CTR-by-Position Curve
- Turning CTR Benchmarks Into a Prioritization Plan
- Where These Benchmarks Come From
- Why Segmentation Is the Real Skill Now
- Build Your CTR Curve Without the Row Limits
- Sources
- FAQ
CTR by Position: What the Data Actually Shows
There is no single correct number for position-1 CTR, and that’s the first thing to accept before you build anything. First Page Sage’s meta-analysis puts position 1 at 39.8% in clean organic SERPs, meaning results with minimal ads, no AI Overview, and no local pack crowding the page. Backlinko’s analysis of 4 million search results lands considerably lower, at roughly 27.6%, with the top three positions together capturing about 54.4% of all clicks. Neither number is wrong. They measure different SERP conditions.
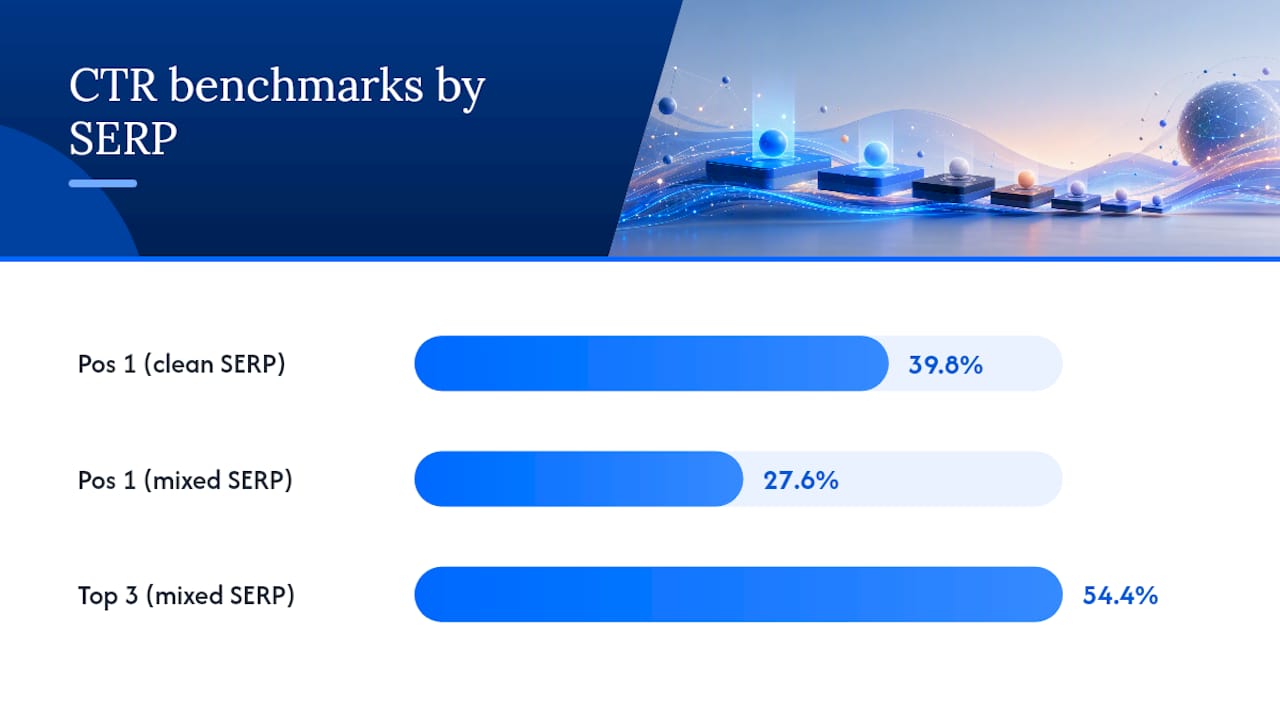
Think of these as two ends of a spectrum rather than competing claims. The gap exists because Backlinko’s sample mixes in SERPs cluttered with features that siphon clicks away from organic listings, while First Page Sage’s clean-SERP subset isolates the best-case scenario. Advanced Web Ranking’s device-separated curves add a third variable, showing that desktop and mobile position-1 values can differ substantially depending on the sample and query mix.
Here’s a consolidated view using the optimistic (clean-SERP) and mid-range (mixed-SERP) columns side by side:
Use the optimistic column when you’re forecasting a query with no ads, no AI Overview, and no local pack. Use the mid-range column for anything else, which in 2026 is most searches. Beyond position 10, the cliff is steep: page-2 results typically capture a low single-digit share of total clicks combined, so ranking improvements that keep you on page 2 rarely move the needle on traffic.
How AI Overviews and Other SERP Features Change Your Clicks
A low CTR at position 3 doesn’t always mean your title tag is weak. It often means the SERP itself has changed shape. Several analyses tracking AI Overview rollouts report notable reductions in clicks to the top organic result on informational queries, with some estimates in the 34% to 58% range for position 1 depending on the study and query sample. That’s a meaningful chunk of traffic disappearing before a searcher ever scrolls past the summary box.
AI Overviews aren’t the only feature reshaping the click economy. Here’s how the major ones tend to behave:
- AI Overviews: Compress clicks to organic results, especially for “what is,” “how to,” and comparison queries.
- Featured snippets: Often satisfy the query directly, reducing CTR for the position-1 organic listing beneath them.
- Local Pack: Pushes organic results below the fold for location-based searches, cutting into visibility regardless of rank.
- Ads: Two or more ads above the fold can meaningfully depress top-organic CTR on commercial queries.
- Video and shopping carousels: Redirect attention and clicks away from standard blue-link results.
Pro Tip: Segment your queries into “has AI Overview” versus “no AI Overview” before you compare CTR across positions. Mixing the two produces an average that describes neither group accurately.
Once you’ve segmented, test whether getting cited inside an AI Overview recovers some of that lost traffic. Pages cited within the overview tend to see better organic click performance than uncited competitors on the same query, which makes structured, extractable content worth the effort even in an AI-summarized SERP.
How Device and Search Intent Shift the CTR Curve
Two searches ranking at the same position can produce wildly different click rates depending on who’s searching and how. Desktop users browsing a clean SERP tend to click the top organic result at a noticeably higher rate than mobile users hitting the same query, largely because mobile screens surface more zero-click features (AI Overviews, “People also ask,” knowledge panels) before the first blue link even appears.
Query intent matters just as much as device. A handful of practical rules:
- Strip out brand queries before calculating benchmarks. Someone searching your company name behaves nothing like someone searching a generic term, and mixing the two inflates your average.
- Split every curve by device from the start. Don’t average desktop and mobile together and call it one benchmark.
- Expect long-tail, high-intent queries to outperform short generic ones at the same rank. A five-word question tends to convert better on clicks than a two-word head term buried in a crowded SERP.
- Treat brand and non-brand as two entirely separate datasets, not two rows in the same table.
How to Build Your Own CTR-by-Position Curve
Published benchmarks tell you what’s typical elsewhere. They don’t tell you what’s happening on your own site. Building your own curve from Google Search Console data takes about twenty minutes once you know the sequence, and it’s the only benchmark that actually reflects your query mix, your industry, and your SERP competition.
Here’s the process:
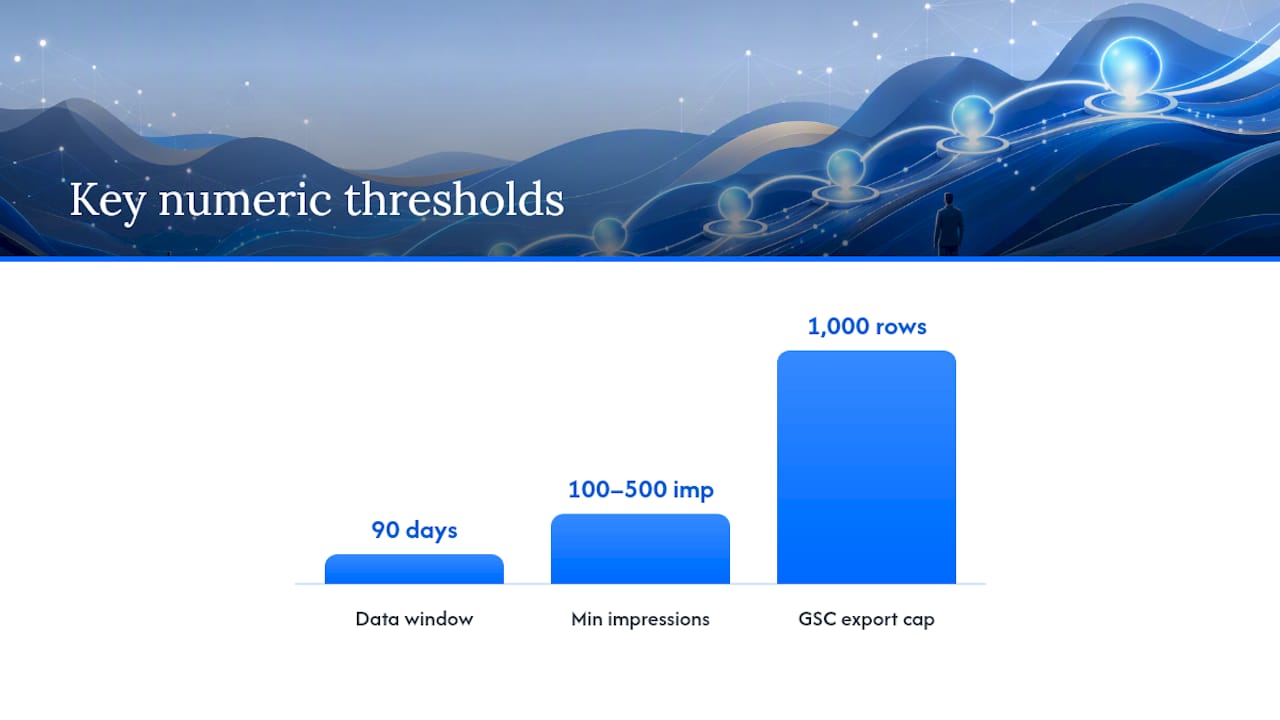
- Choose a data window. Pull at least 90 days from the Performance report; anything shorter gets noisy fast.
- Export the Queries table. Google Search Console’s Performance report defines clicks, impressions, and average position exactly as you’ll need them for this calculation.
- Filter out brand queries. Remove anything containing your company or product name.
- Split by device. Run the analysis separately for desktop and mobile.
- Group by rounded position. Bucket queries by their average position (1, 2, 3, and so on) rather than treating decimals as distinct values.
- Weight by impressions. A position with 20,000 impressions tells you far more than one with 40. Set a minimum impression threshold, often somewhere around 100 to 500 depending on your site’s traffic volume, and drop anything below it.
- Calculate CTR per bucket. Clicks divided by impressions, position by position.
Pro Tip: Don’t trust any bucket built from fewer than a few hundred impressions. A handful of clicks on a handful of impressions produces a CTR that looks dramatic and means nothing.
The Google Search Console interface caps exports at 1,000 rows, which is fine for a single small site but breaks down fast once you’re managing several properties or a large keyword footprint. A tool built to pull larger exports without that row ceiling makes this process repeatable across every property you manage, rather than a manual export you redo by hand each quarter.
Turning CTR Benchmarks Into a Prioritization Plan
Once you have your curve, the real question is where to spend your time. Not every underperforming page deserves the same fix, and chasing rank isn’t always the answer.
The highest-leverage move, backed consistently across studies, is closing the gap between position 2 and position 1. The relative CTR gain from moving into the top spot tends to dwarf the gain from climbing, say, position 10 to position 9, because the top two positions sit above the fold and absorb the bulk of clicks before a searcher scrolls. If a page is stuck at position 2 or 3 with strong impressions, that’s where title and meta description work pays off fastest, and Serpview’s snippet optimizer is built for exactly that kind of testing.
When a page underperforms its expected CTR, run through this checklist before assuming the ranking itself is the problem:
- Does the title tag actually match what the searcher is looking for, or is it generic?
- Does the live SERP show an AI Overview, featured snippet, or Local Pack pushing you below the fold?
- Is the query intent mismatched (informational content ranking for a transactional search, for instance)?
- Is there a schema markup opportunity (FAQ, review, product) that a competitor is using and you aren’t?
To estimate the payoff of a rank move, multiply the impression volume for that query by the expected CTR delta between your current position and the target position, then apply your site’s typical conversion rate to translate clicks into revenue. If you need help turning that click volume into actual conversions once it lands, a resource like Baby Love Growth’s conversion rate optimization guide is a solid next step for closing that loop.
Where These Benchmarks Come From
The ranges in this guide come from reconciling several independent datasets that measure CTR differently. First Page Sage’s meta-analysis isolates clean SERPs; Backlinko’s four-million-result study reflects a more typical, feature-heavy mix; Advanced Web Ranking splits everything by device. None of the three is measuring the same thing, which is exactly why a single “correct” CTR table doesn’t exist.
The real insight isn’t which study is right. It’s that CTR by position is a distributional question shaped entirely by SERP composition, query intent, and device. Treat any published table as a scenario-specific starting point, not a universal answer, and always check the live SERP before trusting a number.
Reproducing this kind of segmented analysis across dozens of client properties is exactly what a high-row-limit export and cross-property dashboard is built to handle at scale.
Why Segmentation Is the Real Skill Now
Post-AI Overview, the CTR-by-position conversation has split in two. There’s the old click economy, where rank alone predicted traffic reasonably well, and there’s the new one, where the SERP’s feature composition often matters more than the blue-link position underneath it. Treating these as one curve is the most common mistake I see agencies make when they report CTR to clients.
The discipline that actually holds up is boring but effective: segment every query set by AI Overview presence, device, and brand versus non-brand before you draw a single conclusion. Agencies managing multiple client accounts need a consistent, repeatable process for this, not a one-off spreadsheet exercise redone differently each quarter. That governance, more than any specific benchmark number, is what separates useful CTR reporting from noise.
— Utsav Chopra
Build Your CTR Curve Without the Row Limits
Serpview solves the problem this entire guide is built around: Google Search Console caps your export at 1,000 rows, which makes real position-by-position segmentation nearly impossible once you’re managing more than one property or a large keyword footprint. Serpview pulls up to 50,000 rows per export, so you can filter brand queries, split by device, and group by rounded position without hitting a wall halfway through the analysis.

The platform’s query counting by ranking tier feature does the bucketing step automatically, and built-in CTR benchmarking compares your curve against industry ranges so you’re not guessing whether a dip is a ranking problem or a SERP-feature problem. Agencies running this across multiple client accounts can use the shared dashboard to keep every property’s curve organized in one place instead of a folder of exports. Start with the free SEO tools to test a snippet rewrite, or set up a workspace to run the full segmented analysis on your own data.
Sources
- Google Click-Through Rates (CTRs) by Ranking Position in 2026 — FirstPageSage
- We Analyzed 4 Million Google Search Results. Here’s What We Learned About Organic Click Through Rate — Backlinko
- What are impressions, position, and clicks? — Google Search Central
FAQ
Is a 4% CTR Good?
It depends entirely on position and SERP type.
What’s a Good Average CTR?
There’s no single universal number, since average CTR depends on your ranking distribution, device mix, and how many of your queries trigger AI Overviews or other SERP features. A more useful approach is comparing your own CTR against your own historical baseline, segmented by position and device.
What Is the 80/20 Rule in SEO?
In the context of CTR, it reflects the fact that the top few organic positions, especially positions 1 through 3, capture the large majority of clicks on a given SERP, while positions below that share a small remaining slice. This is why prioritizing moves into the top two positions produces disproportionate returns.
What Is a Good CTR Ratio?
A good CTR ratio is one that meets or exceeds the typical range for your specific position, device, and SERP feature mix, not a fixed percentage. Building your own CTR benchmark from Search Console data, weighted by impressions, gives you a far more accurate target than any published industry table.
Recommended
Ready to unlock your full GSC potential?
SERPView helps you access all your Google Search Console data without limitations. Start your free trial today.
Get Started Free