
SEO CTR Benchmarks for 2026: What the Data Actually Shows
SERPView Team
SEO Analytics
Top organic position still commands the biggest share of clicks, but the number you should plug into a forecast for 2026 depends entirely on what sits above it. Add an AI Overview above that same result, and clicks can fall significantly.
That gap is the whole story of modern CTR benchmarking. You can’t quote a single number anymore and expect it to hold up in a stakeholder meeting. Three things move the needle before you even look at your title tag:
- Industry variance: healthcare and B2B queries often see CTRs a fraction of what eCommerce or local-service queries pull at the same position.
- Device differences: mobile SERPs compress real estate, and that changes how much of a result’s CTR ends up eaten by ads, maps, or a Google-generated answer.
- SERP-feature suppression: an AI Overview, featured snippet, or local pack sitting above your listing can cut expected clicks even when your rank stays the same.
Before you benchmark anything, open Google Search Console, filter a target query, and check whether its SERP currently shows an AI Overview or featured snippet. That single check tells you which caveat applies and keeps you from chasing a CTR number the SERP was never going to deliver.
Key Takeaways
Realistic organic CTR targets depend on SERP context, industry, and device far more than on position alone, and treating a single average as a universal target guarantees a misread benchmark.
| Point | Details |
|---|---|
| Segment before comparing | Split CTR data by device, brand versus non-brand, and SERP feature presence before judging performance. |
| Use percentile bands | Compare against your own P25 to P75 range rather than a single cross-industry average CTR figure. |
| Check SERP context first | An AI Overview or featured snippet can cut expected CTR by roughly a third to over half at the same position. |
| Wait for significance | Give tests enough impressions, generally a few hundred, before calling a title or meta change a winner. |
| Consolidate your exports | SERPView pulls up to 50,000 rows across properties, making query-level CTR benchmarking practical at scale. |
Table of Contents
- SEO CTR Benchmarks by Position: The Curve You Should Actually Use
- Benchmark SEO Performance by Industry and Device
- How AI Overviews and Other SERP Features Change Expected CTR
- Branded vs. Non-Branded Queries: Why Your CTR Average Is Misleading
- How to Measure CTR Correctly Before You Benchmark Anything
- Building a Defensible CTR Benchmark Methodology
- Tactics That Actually Move Organic CTR
- Reading CTR Data Without Jumping to the Wrong Conclusion
- How SERPView Strengthens Your CTR Benchmarking Data
- Where Most Teams Get CTR Benchmarking Wrong
- Turning CTR Benchmarks Into a Repeatable Workflow With SERPView
- Sources
- FAQ
SEO CTR Benchmarks by Position: The Curve You Should Actually Use
CTR drops fast as rank moves down the page, but how fast depends heavily on whether the SERP is clean or feature-heavy. Clickrank puts position 1 at roughly 27.6% CTR on clean SERPs, a figure that reflects the steady erosion since 2022 as AI Overviews and richer features have eaten into organic clicks. DollarPocket’s competing analysis reports a higher clean-SERP baseline near 39.8% for position 1, but shows that number collapsing to roughly 19% or lower once an AI Overview appears above the result. The spread between those two figures is itself the lesson: SERP context matters more than the position number alone.
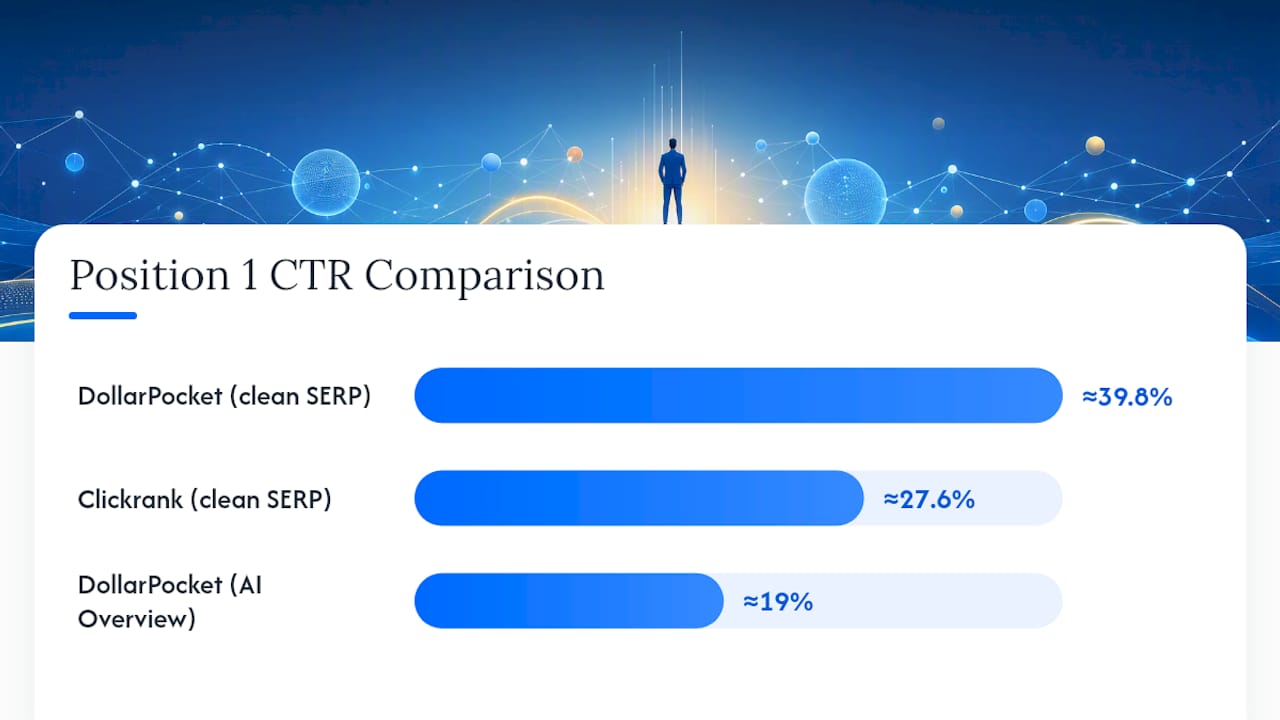
Picture the curve as a steep drop from position 1 to position 3, then a long, flat tail from position 4 onward. That shape hasn’t changed much over the years. What’s changed is the height of the first bar, and how often something else gets stacked on top of it before a user even reaches your blue link.
Pro Tip: Don’t trust a CTR curve built on low-impression queries. Filter your Search Console data for queries with at least 100 to 200 monthly impressions before you compare them against any published benchmark.
A few things to keep in mind when you map your own rankings against this curve:
- Position 1 CTR has been trending down year over year as AI Overviews expand to more query types.
- The gap between position 1 and position 2 is usually larger than the gap between positions 2 through 5 combined.
- Average position from Search Console is a blended metric. A query bouncing between position 1 and position 4 will show a CTR that doesn’t match either position cleanly.
Benchmark SEO Performance by Industry and Device
Averaging CTR across every industry produces a number nobody can use. Seoprofy’s industry breakdown shows vertical medians spread wide, with categories like online communities landing around 3.5% median CTR while more clinical or research-heavy topics land under 1.5%. That range alone should tell you why a single cross-industry average is close to useless for setting targets.
Typical position-1 patterns by vertical, drawn from aggregated industry data:
- eCommerce: strong clicks at position 1, often pulled down by shopping ads and product carousels above organic results.
- B2B and SaaS: lower absolute CTR at every position because these queries frequently trigger AI Overviews and comparison-style snippets.
- Healthcare: CTR suppressed further by featured snippets and knowledge panels that answer the query directly on the SERP.
- Finance: heavy ad density above the fold compresses CTR even for well-ranked organic results.
- Local services: local pack placement often outperforms standard organic CTR, so ranking well organically may matter less than showing up in the map results.
Mobile and desktop split matters just as much as vertical. Mobile screens show fewer organic results above the fold, and local packs, shopping carousels, and “People also ask” boxes take up proportionally more space. That usually pushes mobile CTR below desktop CTR at the same position, even when rank is identical across devices.
Here’s the practical rule: use industry benchmarks to sanity-check whether your numbers are in the right neighborhood, but build your real targets from your own site’s percentile bands. Benchmarketing’s approach of comparing performance against P25, median, and P75 bands rather than a flat average applies just as well to organic CTR as it does to paid metrics. If your query sits in your own P75 band, a generic industry average telling you that you’re “below benchmark” is simply the wrong comparison.

How AI Overviews and Other SERP Features Change Expected CTR
SERP features don’t just sit next to organic results, they actively pull clicks away from them.
Typical impact ranges by feature:
- AI Overview: −34.5% to −58% organic CTR relative to a clean SERP for the same position.
- Featured snippet: roughly −20% to −30% for the organic results sitting below it.
- Local pack: draws clicks toward map listings, often at the expense of standard organic results for location-based queries.
- Shopping results: compresses clicks to organic product pages, particularly on mobile.
- Knowledge panel: reduces the need to click through at all for simple factual queries.
- Video or thumbnail results: can boost CTR for the specific result carrying the thumbnail, sometimes at the expense of neighboring text results.
The clearest real-world pattern shows up on informational queries where an AI Overview fully answers the question in the generated summary. Share of voice for the page that used to hold position 1 doesn’t disappear from the rankings report, but the clicks that used to come with that rank shrink dramatically. A result sitting below an AI Overview can look like it’s ranking well while actually delivering a fraction of its historical traffic.
Pro Tip: When zero-click SERPs increase for a query set, stop leaning on CTR alone as your success metric. Track impressions and average position trend instead, since those numbers tell you whether you’re still winning visibility even as raw clicks decline.
Branded vs. Non-Branded Queries: Why Your CTR Average Is Misleading
Branded queries inflate your blended CTR average in ways that hide your true non-branded performance.
Quick definitions worth locking down for reporting purposes:
- Branded queries: searches that include your company, product, or trademark name.
- Non-branded queries: searches describing a need, category, or problem without naming your brand.
Mixing the two in a single CTR report tells you almost nothing about how well your titles and meta descriptions are actually performing on the queries that bring in new prospects. A reasonable reporting split for most sites separates the two entirely, with branded traffic reported as its own line item rather than blended into an overall organic CTR figure. Sites with strong brand recognition can see branded queries account for a large share of total organic clicks, which means a blended average CTR might look healthy while your true growth lever, non-branded CTR, sits well below target.
To isolate the split, export your Search Console query data and filter out anything containing your brand name and common misspellings. What’s left is the non-branded set worth benchmarking against industry and position curves. Understanding search intent at the query level helps here too, since branded and non-branded queries often carry different intent even when they land on the same page.
How to Measure CTR Correctly Before You Benchmark Anything
Bad benchmarking usually starts with bad measurement, not bad targets. Get the export right first.
- Open Search Console’s Performance report and filter to the query or page level you want to analyze.
- Set the date range to at least 90 days to smooth out weekly and monthly noise.
- Export impressions, clicks, CTR, and average position together, never CTR alone.
- Pair the export with GA4 sessions and conversion data so you can see whether CTR changes are actually translating into site behavior.
- Segment by device before comparing anything across queries, since mobile and desktop CTR rarely move together.
- Watch for Search Console’s data sampling and row limits, which can quietly distort a benchmark built on a large query set.
Search Engine Land’s benchmarking framework recommends exactly this kind of paired export as the foundation for any defensible SEO baseline, gathering organized data before setting monitoring cadences or comparing against competitors.
Different tool categories solve different pieces of this problem:
- Google Search Console: the source of truth for impressions, clicks, and CTR, but capped at 1,000 rows in the standard UI.
- GA4: adds session and conversion context that CTR alone can’t provide.
- Rank trackers: fill in daily position data between Search Console’s own position averages.
- Consolidated export tools: pull GSC data across properties and beyond the UI’s row limits, which matters enormously once you’re managing more than a handful of sites or query sets.
Pro Tip: Reliably exporting more than 1,000 rows from Search Console’s own interface requires either the API or a consolidation tool. Whichever method you use, keep query-level context attached to every row. A benchmark built from aggregated totals without query detail can’t be re-segmented later when you need to isolate branded traffic or a single SERP feature.
Building a Defensible CTR Benchmark Methodology
A benchmark that can’t survive a stakeholder asking “where did this number come from” isn’t a benchmark, it’s a guess with a chart attached. Build yours with a few non-negotiable pieces in place.
Start with sample size and time window. A query with fewer than 100 monthly impressions shouldn’t anchor a benchmark on its own; group it with similar queries or exclude it. For time windows, 90 days is the practical minimum for a stable read, while six months smooths out seasonal spikes that would otherwise skew a shorter snapshot. If your business has an obvious seasonal pattern, such as holiday retail or tax-season finance content, compare year-over-year windows rather than month-over-month.
Benchmark statistic: Benchmarketing’s percentile framework reports a median CTR of 6.11% with a P25 of 3.2% and a P75 of 9.8% in their dataset, a spread wide enough to show why a single average obscures more than it reveals.
That kind of spread is exactly why percentile bands beat averages for benchmarking. A median tells you where the middle of your query set sits, while P25 and P75 show you the realistic floor and ceiling for a well-performing page. If a query lands in your own P75 band, treating it as “underperforming” against an industry average is a mistake in the comparison, not the query.
Segmentation rules to lock in before you start comparing numbers:
- Decide whether you’re benchmarking at the query level or the page level, since a page ranking for dozens of queries will show a blended CTR that hides individual query performance.
- Split by device every time, never blend mobile and desktop into one CTR figure.
- Separate by intent where possible, since informational and transactional queries behave differently even at the same position.
- Always report brand and non-brand separately, as covered above.
Tactics That Actually Move Organic CTR
Once you know your baseline, prioritize tactics by how much CTR they’re likely to move, not by how easy they are to implement.
- Rewrite title tags first. This is usually the highest-leverage change available, since the title is the first thing a searcher reads.
- Rework meta descriptions to match query intent. A description that answers the searcher’s actual question outperforms generic marketing copy.
- Add structured data where eligible. Structured data can win rich snippet placements like star ratings, FAQ dropdowns, or breadcrumbs that make a listing stand out.
- Align content with true search intent. A page ranking for a query it doesn’t actually satisfy will see rank without CTR, no matter how the title reads.
- Target SERP feature capture directly. If a featured snippet exists for your target query, restructuring your content to win that snippet often lifts clicks more than any title tweak.
Build every test around a simple structure: hypothesis, segment, metric, and a significance threshold before you touch anything live.
- Hypothesis: “Adding a number and a benefit to the title will increase CTR for this query cluster.”
- Segment: define the exact query or page set the test applies to, and keep device and intent consistent within it.
- Metric: CTR is the primary metric, but track clicks and impressions separately so a drop in impressions doesn’t get misread as a CTR failure.
- Significance threshold: don’t call a winner from a week of data on a low-impression page. Give the test enough volume and time, generally two to four weeks minimum, before drawing conclusions.
A few structural examples worth testing directly against each other:
- Benefit-first: “Cut Your Onboarding Time in Half With This Checklist”
- Number-led: “7 CTR Benchmarks Every SEO Team Should Know in 2026”
- Urgency modifier: “2026 CTR Benchmarks: What Changed and Why It Matters Now”
Test these variations using a SERP snippet optimizer before pushing them live, since previewing how a title and description actually render on both mobile and desktop catches truncation issues a plain text edit misses. The broader free SEO tools collection covers schema testing and description generation for the same workflow.
Reading CTR Data Without Jumping to the Wrong Conclusion
Low CTR looks like a snippet problem far more often than it actually is one. Before you touch a title tag, run through the usual suspects.
- Low impressions: a query with fewer than 100 monthly impressions produces noisy CTR that shouldn’t drive a decision on its own.
- Rank volatility: a page bouncing between positions 3 and 9 over a month will show a blended CTR that doesn’t match any single position benchmark.
- Seasonality: a CTR drop in a slow season can look like a snippet failure when it’s really demand disappearing across the whole category.
- Brand cannibalization: two of your own pages competing for the same non-branded query can each show suppressed CTR even though total clicks across both pages are healthy.
When CTR looks low, work through the diagnosis in order rather than jumping straight to a rewrite. Check whether a SERP feature has appeared above your result first. If not, compare mobile CTR against desktop CTR for the same query, since a device-specific problem needs a different fix than a universal one. Then actually look at the live snippet, since a truncated title or an unappealing meta description auto-generated by Google is a common and fixable culprit. Only after ruling out those three should you run a snippet test.
One more distinction worth holding onto: CTR measures whether people click, conversion rate measures whether the click was worth earning. If your CTR is healthy but conversions lag, the problem sits on the page, not in the snippet, and no amount of title testing will fix it.
How SERPView Strengthens Your CTR Benchmarking Data
Most CTR benchmarking breaks down at the data layer long before it breaks down at the strategy layer. Search Console’s UI caps exports at 1,000 rows, which is nowhere near enough for a site with thousands of ranking queries across multiple properties. SERPView consolidates Search Console exports across properties and supports pulling up to 50,000 rows, which means you can build query-level and page-level benchmarks without stitching together dozens of manual exports.

A benchmark report worth building should capture these fields for every query and page combination:
| Field | Why it matters |
|---|---|
| Query and page | Lets you separate query-level intent from page-level performance |
| Impressions and clicks | The raw inputs CTR is calculated from |
| CTR and average position | The two metrics that need to move together for a benchmark to mean anything |
| SERP feature flag | Marks whether an AI Overview, snippet, or local pack was present |
| Device | Separates mobile and desktop performance |
| Date window | Anchors the benchmark to a specific, reproducible period |
Capturing the SERP feature flag alongside standard metrics is the piece most teams skip, and it’s exactly what lets you build the clean-versus-feature-suppressed comparison this article has walked through position by position. Once those fields are in place, sorting your query set into P25 through P75 bands, the same approach Benchmarketing uses for paid metrics, becomes a filtering exercise instead of a manual spreadsheet project. SERPView’s own guide to search performance benchmarking walks through building this kind of report from a raw export.
Where Most Teams Get CTR Benchmarking Wrong
The most common mistake isn’t a bad tactic, it’s a bad comparison. A team pulls a published CTR benchmark, holds their own numbers against it, and panics when the numbers don’t match, without ever checking whether the benchmark’s SERP context matches their own. One query set I’ve seen this play out on repeatedly involves B2B software queries where a team compared their position-3 CTR against a generic eCommerce benchmark. The eCommerce number was nearly double what their own vertical typically supports, and the “problem” they thought they had didn’t exist once the comparison was corrected.
The second recurring mistake is calling a title test after a few days of data on a low-volume page. Waiting for enough impressions to accumulate, generally a few hundred at minimum, turns a coin flip into an actual signal.
Three corrections worth making immediately if you recognize either pattern in your own reporting:
- Segment branded and non-branded queries before running any comparison against a published benchmark.
- Sequence your tests: fix measurement and segmentation before you touch titles, not after.
- Choose CTR as your primary metric only when impressions are stable; use impressions or average position instead for genuinely low-volume queries.
Before calling any test result final, confirm the sample size and duration actually support statistical significance. A benchmark built on noise is worse than no benchmark at all, because it gives you false confidence in a direction that isn’t real.
Turning CTR Benchmarks Into a Repeatable Workflow With SERPView
Building one clean CTR benchmark is useful. Rebuilding it every month across dozens of properties by hand is where most SEO teams quietly give up. SERPView is built for exactly that gap, consolidating Search Console data across every property you manage into a single dashboard, with pre-built CTR benchmarking reports that don’t require rebuilding a spreadsheet from scratch each cycle.

The core features map directly onto the workflow this article has walked through: exports up to 50,000 rows for query-level segmentation, shared dashboards for teams that need client-ready reporting without a manual export step, and pre-built filters that isolate SERP features so you’re comparing clean SERPs against feature-heavy ones instead of blending them together. A typical workflow looks like this: consolidate GSC exports across properties in SERPView, segment the resulting dashboard by device and SERP feature flag, identify which query clusters sit below your own P25 band, and hand that shortlist directly to your snippet testing process.
If you’re managing more than one property and still exporting from the Search Console UI one at a time, that’s the exact bottleneck worth fixing first. Check the shared dashboard feature to see how consolidated reporting works before your next benchmarking cycle.
Sources
A few sources did the heavy lifting behind the numbers in this article, and each is worth returning to as SERP behavior keeps shifting through 2026.
- How to benchmark your SEO performance in 2025 — Search Engine Land
- Clickrank
- SEO CTR Benchmarks 2026 — DollarPocket
- Click-Through Rate Benchmarks by Industry — Seoprofy
- Google Ads Benchmarks — Benchmarketing
For downloadable templates that turn these frameworks into a working report, SERPView’s blog on SEO performance benchmarks and its tools directory cover the practical build side of what’s outlined above. Readers evaluating export workflows more broadly may also find this technical SEO tools comparison and this guide to AI’s role in SERP analysis useful for context on how the broader tool landscape is adapting to AI-driven SERPs.
FAQ
What is a good CTR for SEO?
What is the 80/20 rule in SEO?
Is 7% a good CTR?
Is 2% a good CTR?
How do I isolate branded query CTR from my overall benchmark?
Export your Search Console query data, filter out your brand name and common misspellings, and benchmark the remaining non-branded queries separately, since blended reporting typically overstates true SEO performance.
Recommended
Ready to unlock your full GSC potential?
SERPView helps you access all your Google Search Console data without limitations. Start your free trial today.
Get Started Free