
Search Analytics Data Export Step by Step: 2026 Guide
SERPView Team
SEO Analytics

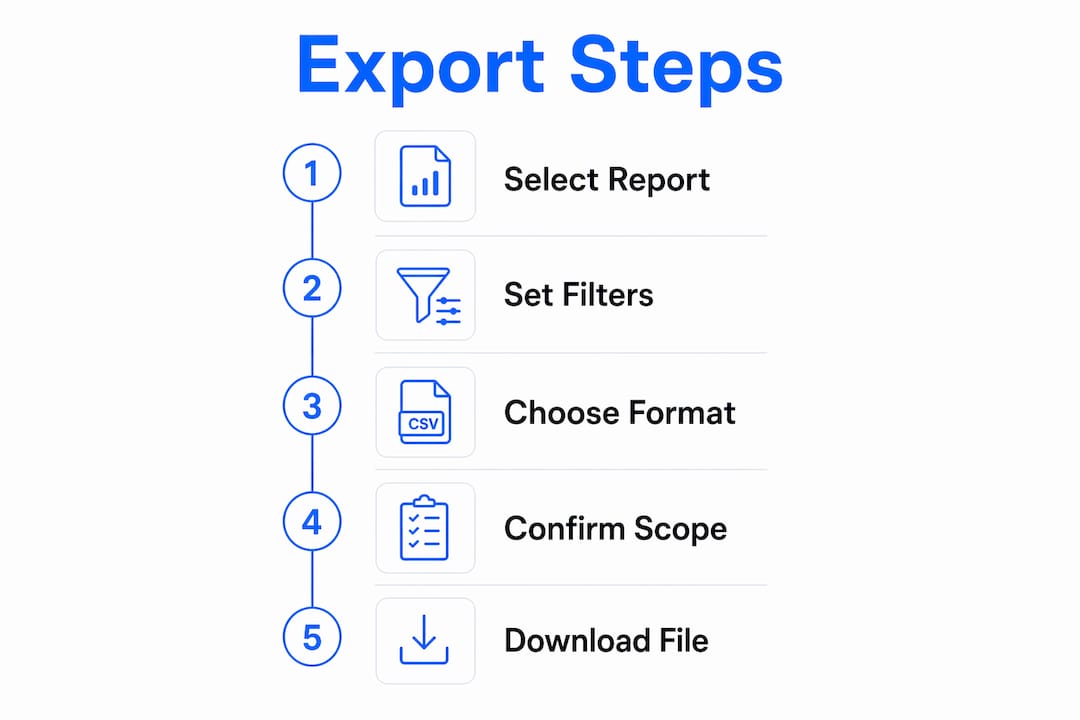
How to export search analytics data: the quick steps
Getting your search analytics data out of a platform and into a usable file takes fewer steps than most analysts expect. Here is the core process, applicable across most analytics platforms:
- Open your analytics platform and navigate to the report or dashboard you want to export.
- Set your date range before exporting. A mismatched date range is the most common cause of incomplete data.
- Apply any filters you need, such as device type, country, or traffic segment.
- Locate the export button. In most platforms, it appears as a download icon or an “Export” label near the top right of the report view.
- Select your file format: CSV for spreadsheet analysis, PDF for sharing with stakeholders, or Google Sheets for collaborative work.
- Download or receive the file. Most platforms trigger an immediate download; some offer an email link for larger exports.
That six-step sequence covers the majority of standard export scenarios. The sections below go deeper on each platform and use case.
Table of Contents
- Detailed steps for configuring and running a data export
- How to export data from GA4 step by step
- How to handle and organize your exported analytics files
- Best practices and expert insights for accurate data exports
- How to fix common export errors
- Privacy and data security when exporting analytics data
- Serpview gives you more data without the manual export cycle
- Key Takeaways
- FAQ
Detailed steps for configuring and running a data export
Knowing where the export button lives is only part of the process. The configuration choices you make before clicking it determine whether the data you get is actually usable.

Navigating to the right report

Start in the specific report that contains the metrics you need. Exporting from a summary view often gives you aggregated data with fewer dimensions than a dedicated report. For search analytics filters, go directly to the queries or pages report rather than the overview.
Configuring filters and dimensions
- Select the dimensions you need: queries, pages, countries, devices, or search type.
- Add filters to narrow the dataset before export, not after. Filtering post-export in a spreadsheet works, but it adds steps and increases the chance of error.
- Confirm your date range one more time. A rolling 28-day window and a fixed calendar month produce different row counts.
Working through the export dialog
Most platforms present a dropdown or modal when you click “Export.” Choose your format, confirm the scope (current view vs. all data), and initiate the download.
Pro Tip: Before sharing any export, validate the numbers against your live dashboard. Filter misalignments between the export configuration and the dashboard view are a frequent source of reporting errors.
How to export data from GA4 step by step
Google Analytics 4 has two distinct export paths: standard reports and Explorations. Each works differently, and knowing which one to use saves time.
Exporting from standard reports in GA4
- Sign in to GA4 and open the Reports section from the left navigation.
- Select the report you want, such as “Pages and screens” or “Traffic acquisition.”
- Set your date range using the calendar in the top right.
- Click the Share this report icon (the arrow-and-box symbol near the top right).
- Choose Download file and select your format: CSV or PDF.
Exporting from Explorations
Explorations give you more control over dimensions and metrics, making them better suited for deep analysis.
- Open Explore from the left navigation and build or open your exploration.
- Click the Export data icon in the top right corner.
- Select CSV or Google Sheets. Note that PDF is not available from Explorations.
GA4 exports from the UI are capped at the rows visible in the current view. For larger datasets, the GA4 BigQuery export integration bypasses that limit entirely, delivering raw, unsampled hit-level data to cloud storage on a scheduled basis.
Format guidance: CSV works well for Excel or Google Sheets analysis. Google Sheets suits collaborative review. PDF is best for static stakeholder reports where no further manipulation is needed.
How to handle and organize your exported analytics files
Downloading the file is not the end of the process. How you open, name, and store it affects every analysis that follows.
Opening TSV and CSV files correctly
- CSV files open directly in Excel or Google Sheets without any special steps.
- TSV files require extra care. Opening a TSV directly in Excel can collapse all columns into one. Use Excel’s Import Text Wizard instead: go to Data > Get External Data > From Text, select tab-delimited, and map the columns correctly.
- XLSX files open natively in Excel with no additional steps.
Naming conventions and folder structure
Consistent naming prevents the “which version is this?” problem that plagues most reporting workflows. A reliable convention: Platform_ReportType_YYYYMMDD.csv (for example, GA4_OrganicTraffic_20260601.csv). Store exports in folders organized by month, then by property or client.
Pro Tip: *Scheduling recurring exports in GA4 or enterprise platforms removes the manual step entirely and reduces the risk of missed reporting periods. Pair scheduled exports with automated cloud pipelines to push files directly into your storage or warehouse on a set cadence. *
Best practices and expert insights for accurate data exports
Getting data out of a platform is straightforward. Getting data you can trust takes more discipline.
Validate before you distribute
Cross-check exported totals against your live dashboard for the same date range. A discrepancy of even a few percentage points usually points to a filter that was active in the UI but not applied during export.
Match your format to your destination
Format selection directly affects downstream usability. CSV suits spreadsheet-based reporting. JSON or Parquet handles large-scale ingestion into cloud data warehouses far better than CSV does at volume.
Use APIs and BigQuery for scale
Standard UI exports hit row limits quickly. Google Search Console’s UI caps exports, but API-driven extraction and BigQuery integrations allow millions of rows of unsampled data, which is the standard approach for enterprise analytics workflows. Understanding GSC data limitations helps you decide when the UI is sufficient and when an API call is the right move.
Watch for blended data streams
Google Search Console’s AI Performance report separates AI-driven clicks from traditional organic clicks. The standard Performance report blends both together, which can obscure whether a traffic change reflects a ranking shift or a change in how Google surfaces your content. Export the AI Performance report separately when you need a clean read on each traffic type.
Archive source exports alongside processed reports
Keeping the raw export file next to your finished report creates an evidence trail. When a metric looks anomalous months later, you can trace it back to the source data rather than guessing whether the number was correct.
How to fix common export errors
Most export problems fall into a small set of repeatable categories.
- Blank or empty file: Usually caused by a date range with no data, or a filter that excludes all rows. Remove filters one at a time to isolate the cause.
- Columns merged into one: A TSV opened directly in Excel. Use the Import Text Wizard as described above.
- Totals don’t match the dashboard: A filter was active in the UI during export but not saved to the export configuration. Re-export with filters explicitly confirmed.
- Export button is grayed out: Some GA4 reports disable export when a comparison is active. Remove the comparison, then export.
- File too large to open: Switch to a cloud-based tool like Google Sheets, or use the API to pull the data in batches.
Privacy and data security when exporting analytics data
Exported analytics files can contain sensitive information, including client URLs, query strings, and user behavior patterns. A few practices keep that data protected.
- Limit access to exported files. Store them in permissioned folders, not on shared drives with open access,
- Avoid uploading raw exports to unvetted third-party tools. A GSC export can contain client queries and URLs; sending that file to an unknown service creates an unnecessary data exposure risk.
- Anonymize where possible before sharing exports externally. Remove or mask any data that could identify individual users.
- Delete exports you no longer need. Retaining stale files with sensitive query data increases your exposure without adding analytical value.
- Use HTTPS-secured destinations for any automated export pipeline that pushes files to an endpoint.
For teams working across multiple search properties, centralizing exports in a single governed environment reduces the number of places sensitive data can leak.
Serpview gives you more data without the manual export cycle

The standard Google Search Console export limits the number of rows per report, which means many sites work with an incomplete picture when pulling data manually. Serpview removes that ceiling, giving you access to up to 50,000 rows across multiple properties in a single unified dashboard. You get query-level segmentation, mobile versus desktop breakdowns, customizable filters, and performance tracking over an extended historical period, all without rebuilding a spreadsheet from scratch each month. For digital marketers and analysts who need reliable, complete data for reporting, Serpview turns what is normally a multi-step manual process into a live, always-current view. Start your free trial at serpview.com and see what your search data looks like without the row limit.
Key Takeaways
A complete search analytics data export requires correct format selection, validated filters, and a clear file-management system before the data is useful for reporting.
| Point | Details |
|---|---|
| Validate before sharing | Cross-check exported totals against your live dashboard to catch filter misalignments. |
| Match format to use case | Use CSV for spreadsheets, PDF for stakeholder reports, and JSON or Parquet for cloud warehouse ingestion. |
| Use APIs for scale | UI exports hit row limits; API-driven extraction and BigQuery deliver unsampled, large-volume data. |
| Separate blended data | Export the AI Performance report separately to avoid mixing AI-driven clicks with traditional organic traffic. |
| Serpview for complete data | Serpview provides a larger number of rows across multiple properties, removing the standard GSC export ceiling. |
FAQ
How do I export all data from Google Analytics?
In GA4, use the BigQuery export integration to access raw, unsampled data beyond the UI row limit. For standard reports, click the Share icon and select “Download file” in CSV or PDF format.
What is the data export process in GA4?
Navigate to a report or Exploration, set your date range and filters, then click the export or Share icon and choose your format. CSV and Google Sheets are available from most views; PDF works from standard reports only.
How do I get data out of Google Search Console?
Open the Performance report, set your date range, and click the download icon to export as CSV. The standard Google Search Console export limits the number of rows per report, but you can use the Search Console API or a tool like Serpview, which surfaces up to 50,000 rows without manual API calls.
How do I export GA4 data to Excel?
Export as CSV from the Share icon in any GA4 standard report, then open the file in Excel. If you receive a TSV file, use Excel’s Import Text Wizard under Data > Get External Data > From Text to map columns correctly.
Recommended
Ready to unlock your full GSC potential?
SERPView helps you access all your Google Search Console data without limitations. Start your free trial today.
Get Started Free