
Win Agency Approval: SEO Traffic Forecasting With 50,000 Row Exports
SERPView Team
SEO Analytics

SEO traffic forecasting turns keyword data and ranking assumptions into a defensible projection of sessions, leads, and revenue. The fastest credible model combines a keyword-level CTR curve with a square-root ramp, then converts projected traffic into revenue against a clear break-even month. It won’t predict the future with precision, but it gives stakeholders something better: a scenario range they can actually approve a budget against.
TL;DR:
- Keyword-based traffic forecasts often rely on a square-root ramp model to reflect realistic ranking progress rather than assuming steady linear gains.
- Trust Google Search Console data over third-party rank trackers because it directly measures Google’s actual site data, ensuring better defensibility.
- Combining historical trend analysis with keyword-level ramp projections creates more accurate, defendable forecasts than using either approach alone.
- Converting traffic into revenue involves applying actual conversion rates and average order values to produce an ROI timeline and break-even point.
- Using a consolidated export of up to 50,000 rows from tools like SERPView streamlines data assembly, making forecasts faster and more defensible for multiple clients.
Table of Contents
- What Is SEO Forecasting and When Do You Need It?
- Which Data Source Should You Trust: First-Party or Third-Party?
- How Do You Build a Keyword-Based Traffic Forecast?
- When Should You Use Statistical or Historical Forecasting Instead?
- How Do You Turn Traffic Projections Into an ROI Timeline?
- What Tools and Templates Should You Use to Forecast Faster?
- How Do You Implement Forecasts With Your Own Analytics Setup?
- Author Perspective: Best Practices and Common Forecasting Mistakes
- How SERPView Simplifies Building a Defensible Forecast
- Sources
- FAQ
What Is SEO Forecasting and When Do You Need It?
SEO forecasting is the practice of projecting future organic sessions, and the leads or revenue those sessions produce, based on keyword targets, current rankings, and expected ranking movement over time. Agencies build these models for one reason above all others: budget approval. A client or CFO rarely signs off on twelve months of SEO spend without seeing when it pays for itself.
The horizon you choose depends on the ask. A 3-month forecast fits a campaign sprint or content push. A 6 to 12 month window suits most retainer renewals and annual planning cycles. A 24 month projection matters most for competitive niches where ranking velocity is slow and seasonality needs to be factored in twice to be trusted.
Precision isn’t the point. Industry strategists note that the real value of a forecast is producing a defensible ROI timeline that secures buy-in, not nailing an exact session count. That reframes how you should present the work:
- Frame every number as a range, not a point estimate
- Show conservative, base, and aggressive scenarios side by side
- Tie every projection to a specific business outcome, not just traffic volume
Which Data Source Should You Trust: First-Party or Third-Party?
First-party Google Search Console data is the backbone of any forecast you’ll actually defend in a client meeting. Third-party rank trackers and traffic estimators are useful for competitive benchmarking, but they’re modeled guesses. GSC reflects what Google itself measured for your site, which makes it the only source you can point to when someone asks “where did this number come from?”
The property type you choose changes what you can see. A Google Search Console domain property aggregates data across every subdomain and protocol, http, https, www, and non-www, into one unified view, which is exactly what you want for a site-wide forecast. A URL-prefix property, by contrast, is scoped to the exact protocol and path you enter when you verify it, so it fragments your data across multiple properties if your site has ever changed domains or migrated protocols.
That said, some teams keep both running. URL-prefix properties still matter for workflows tied to a specific path, like isolating a blog subdirectory or verifying a legacy Disavow tool setup, so don’t decommission one just because you’ve added a domain property.
Before you build anything, run this checklist:
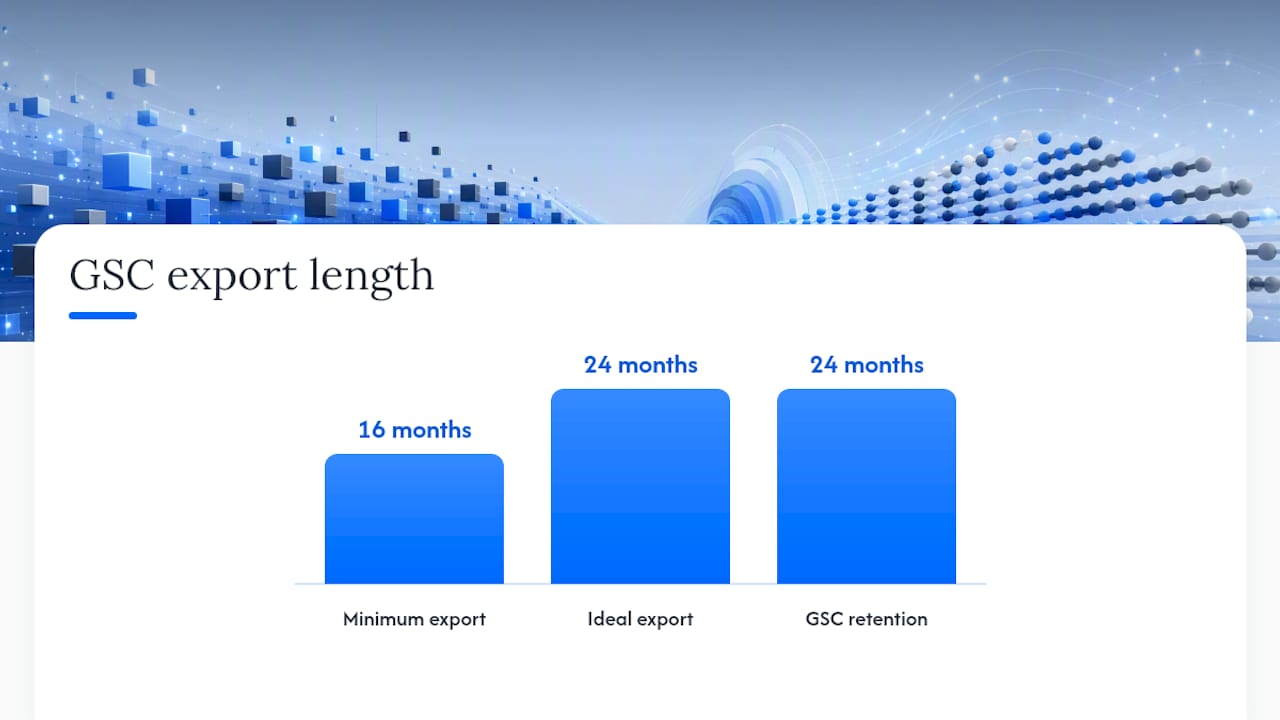
- Export at least 16 months of GSC performance data, ideally the full 24 months GSC retains
- Segment the export by device and country to isolate mobile-versus-desktop and geographic anomalies
- Strip out spikes from known one-off events (a viral link, a bug that inflated impressions, a temporary de-indexing)
- Confirm your property setup with verification options that don’t require DNS access if you’re working with a client who hasn’t granted it yet
Pro Tip: If you manage more than three GSC properties for one client, don’t try to reconcile them manually in spreadsheets. A consolidated export that preserves full row counts saves hours during every rebaseline.
How Do You Build a Keyword-Based Traffic Forecast?
Keyword-based forecasting is the workhorse method for SEO traffic forecasting, and it’s the one clients understand fastest because it maps directly to the keywords they already care about. Here’s the template:
- Pull your target keyword list with current rank, monthly search volume, and search intent for each term
- Apply a position-based CTR curve to estimate clicks at your current and target ranks (more on this below)
- Model ranking velocity with a square-root ramp, not a straight line, so month 1 shows small gains and later months show acceleration as authority compounds
- Convert sessions into leads and revenue using your site’s actual conversion rate and average order value
- Bucket the output into conservative, base, and aggressive scenarios based on different ramp speeds and CTR assumptions
CTR curves matter more than most spreadsheets admit. Many free forecasting tools build these curves from aggregated industry research, similar to what Advanced Web Ranking and Sistrix publish, and they should carry a caveat: informational queries with featured snippets or “People Also Ask” boxes often see position 1 CTR drop well below the textbook rate, while transactional queries with no SERP features tend to convert clicks closer to the historical average.
The ramp function is where most amateur forecasts fail. A straight-line ramp assumes you gain ranking ground at a constant pace every month, which almost never happens. A square-root ramp function models the diminishing-then-accelerating pattern real rankings actually follow, curbing the dangerous optimism that shows up when someone projects a page 3 term hitting position 1 in a straight three-month line.
Worked example: A keyword at position 14 with 2,400 monthly searches and a target of position 4 might sit at roughly 1% CTR today (about 24 clicks) and 6% CTR at position 4 (about 144 clicks). Applying a square-root ramp over six months, rather than assuming a linear jump, might show 40 clicks by month 2, 90 by month 4, and 140 by month 6, a far more defensible curve than a flat six-month straight line to 144.
Run this same logic across your full keyword list, sum the monthly sessions, then move to the revenue conversion step.
When Should You Use Statistical or Historical Forecasting Instead?
Statistical forecasting works best when you have a long, stable performance history and want to project forward without rebuilding a keyword-by-keyword model. If a site has years of consistent organic traffic and no major algorithm hits or redesigns muddying the trend line, decomposing that history into trend, seasonality, and residual noise often produces a tighter forecast than a fresh keyword model would.
Practitioners generally recommend preserving as much historical data as your GSC export allows, since seasonality only becomes visible once you can compare the same months across multiple years. A site with only six or eight months of exported data will miss recurring annual patterns entirely, whether that’s a Q4 retail spike or a back-to-school dip in a B2B niche.
The decomposition itself breaks into three pieces:
- Trend: the underlying direction of traffic once seasonal noise is removed
- Seasonality: repeating patterns tied to the calendar (holidays, fiscal quarters, academic years)
- Residuals: the leftover volatility that neither trend nor seasonality explains, often tied to algorithm updates or one-off events
The strongest forecasts blend both approaches. Use the historical model to set your baseline growth trajectory, then layer the keyword-level ramp projections on top for the specific pages and terms you’re actively optimizing. That hybrid catches organic momentum the keyword model would miss while still giving you keyword-level detail the historical model can’t provide on its own.
How Do You Turn Traffic Projections Into an ROI Timeline?
Stakeholders don’t approve traffic. They approve revenue and a date when the investment pays for itself. Converting your session forecast into that language takes three formulas:
- Leads = Forecasted sessions × conversion rate (use your site’s actual historical rate, not an industry average)
- Revenue = Leads × close rate × average order value (or, for ecommerce, Sessions × conversion rate × average order value directly)
- Cumulative ROI = Running total of forecasted revenue minus running total of program cost, tracked month over month
Plot cumulative investment against cumulative revenue on the same chart, and the point where the two lines cross is your break-even month. That single visual tends to do more persuasive work in a budget meeting than any traffic chart, because break-even framing answers the question every finance stakeholder is actually asking.
Here’s a simplified worked example for a mid-size B2B site spending $8,000 a month on SEO:
In an example for a mid-size B2B site spending on SEO, a forecast can be structured to show increasing sessions and revenue over time, with a break-even point occurring around the end of the first year, providing a clear timeline for stakeholders.
Pro Tip: Always show the base scenario as your headline number, but keep the conservative scenario visible on the same chart. If the conservative case still breaks even within an acceptable window, you’ve made the strongest possible argument for approval.
What Tools and Templates Should You Use to Forecast Faster?
You don’t need custom software to run a credible forecast, but you do need a workflow that handles CSV import and export, position-based CTR curves, and bulk keyword volume, because manually forecasting more than a handful of terms in a spreadsheet becomes unmanageable fast. Look for a calculator or template with these capabilities:
- Bulk keyword import from a CSV, not one-at-a-time manual entry
- A built-in or overridable CTR curve, since public curves rarely match your exact niche
- Ramp modeling that lets you choose between linear and square-root projections
- Native export back to CSV or a shareable dashboard for client reporting
A template CSV built for this purpose typically needs these columns: Keyword, Current Rank, Monthly Search Volume, Target Rank, Estimated CTR at Target, Expected Monthly Sessions, Conversion Rate, Average Order Value, and Projected Monthly Revenue. Build that structure once, and you can duplicate it for every client engagement without rebuilding the logic from scratch.
Free public calculators are a fine starting point for a rough estimate, but always override their default CTR curve and conversion rate assumptions with your own site’s historical numbers before you present anything to a client. The publisher’s free SEO tools can help you prep clean input data before it ever hits the forecasting spreadsheet.
How Do You Implement Forecasts With Your Own Analytics Setup?
Most forecasting breaks down at the data prep stage, not the math stage. Google Search Console’s export limits and scattered property structures make it hard to assemble the long, clean history a good forecast needs, especially for agencies juggling a dozen client accounts across different domains and subdomains.
A practical workflow looks like this:
- Consolidate every client’s GSC properties into one combined export, preserving up to 50,000 rows of query and page data instead of the 1,000 row cap most raw exports hit
- Apply custom annotations to mark site migrations, algorithm updates, or content pushes so your ramp assumptions account for real events instead of unexplained noise
- Filter by device, country, and query type before you calculate CTR curves, since aggregate data hides the mobile-versus-desktop and intent variance that skews forecasts
- Export the cleaned dataset to CSV, run your CTR and ramp model, then generate a visual ROI timeline you can drop straight into a client report
Keeping that much history intact matters more than most teams realize. Preserving larger GSC exports and consolidating properties has a direct, measurable effect on how defensible a forecast looks when a client’s finance team starts asking questions.
Author Perspective: Best Practices and Common Forecasting Mistakes
The forecasts that survive scrutiny are the ones built on assumptions someone wrote down and can defend six months later, as described in Why Monitor SEO Performance: Maximizing Organic Growth. Version your models. Rebaseline quarterly against actuals, not just when a client asks. The single most common mistake isn’t a bad formula, it’s a straight-line ramp paired with a one-size-fits-all CTR curve applied to every keyword regardless of intent or SERP features. Adjust for both, and decide upfront who signs off on scenario ranges before the deck ever reaches a client’s inbox.
— Utsav Chopra
How SERPView Simplifies Building a Defensible Forecast
Building the forecast described above gets slow the moment you’re managing more than one client property, since GSC’s row caps and scattered properties force you into manual reconciliation before you’ve written a single formula. SERPView consolidates every property into one export of up to 50,000 rows, so your historical baseline stays intact instead of getting clipped at the default 1,000 row limit.

That consolidated view also cuts the prep time out of the workflow itself. Instead of stitching together separate GSC exports by hand, you filter by device, country, and query directly inside SERPView, apply custom annotations to flag the site changes that would otherwise skew your ramp assumptions, and export a cleaned CSV straight into your forecasting template. Agencies managing multiple accounts can build white-labeled, client-ready reports from that same export without rebuilding the process for every engagement. Start by exploring the SERPView platform to see how a consolidated dashboard fits into your next forecasting cycle.
Sources
- SEO forecasting insights from industry strategists
- Free SEO Forecasting Tool – Estimate Traffic & ROI Growth
FAQ
Is SEO Still Worth It in 2026?
Yes. Organic search remains one of the few channels where a properly built forecast can show a clear break-even month, and the ROI timeline methodology described above works whether you’re targeting new content or defending an existing budget.
What Does SEO Traffic Mean?
SEO traffic refers to sessions that land on your site from unpaid, organic search engine results, as distinct from paid search, social, or direct visits, and it’s the baseline number every forecasting model in this guide is built to project.
Is SEO Dead Now With AI?
No. AI-driven search features have changed how clicks are distributed across a results page, which is exactly why modern CTR curves need to account for SERP features like featured snippets, but organic ranking still drives measurable sessions, leads, and revenue when forecasted with a realistic ramp model.
How Do I Predict Website Traffic Without Years of Historical Data?
Use a keyword-based CTR and ramp model instead of a historical time-series approach, since it only requires current rankings, search volume, and target positions rather than years of stable performance history.
Recommended
Ready to unlock your full GSC potential?
SERPView helps you access all your Google Search Console data without limitations. Start your free trial today.
Get Started Free