
Historical SEO Data: How to Preserve It and Forecast With It
SERPView Team
SEO Analytics
Historical SEO data is the time-series record of your rankings, clicks, impressions, click-through rate, and average position across dates, devices, and countries. It’s the raw material for forecasting, drop diagnosis, and year-over-year comparisons. The one thing you need to do right now: export or backfill your Google Search Console data before it disappears, or connect an automated sync that preserves it going forward.
Google Search Console only keeps 16 months of performance history in its interface, and once that window rolls forward, the older data is gone unless you already pulled it out. Here’s what that means for your immediate to-do list:
- Export your full available GSC range as CSV or through the API today, not next quarter.
- Set up a recurring pull (daily or weekly) so you never lose another rolling window.
- Store exports somewhere durable, a spreadsheet won’t cut it past a few thousand rows.
Key Takeaways
Preserving historical SEO data before Google Search Console’s 16-month window rolls forward is the single action that makes forecasting and year-over-year analysis possible later.
| Point | Details |
|---|---|
| Export now, not later | GSC retains only 16 months of data, so backfill and export before the window advances. |
| Row limits force API use | The UI caps exports at 1,000 rows, so use the API or a backfill pipeline for full history. |
| Overlay external signals | Combine Google Trends and update timelines with ranking history to isolate real causes of drops. |
| Clean before you trust it | Deduplicate, reconcile preliminary data, and version schema changes before running any analysis. |
| Serpview consolidates the pipeline | It merges multi-property GSC data with exports up to 50,000 rows and automated backfill. |
Table of Contents
- What Historical SEO Data Includes and Why It Matters
- Where To Find Historical SEO Data
- Retention and Export Limits You Need To Plan Around
- How To Collect and Preserve Historical Data Step by Step
- Turning History Into Forecasts and Diagnoses
- A Compact End-to-End Historical Analysis You Can Run Today
- SERPView: Supporting Multi-Year Historical Workflows
- Cleaning Up Historical SEO Data Before You Trust It
- Privacy and Compliance When Handling SEO Data
- Where Historical SEO Data Can Mislead You
- Tools Worth Considering for Deeper Historical Analysis
- Why Serpview Fits This Workflow
- Sources
- FAQ
What Historical SEO Data Includes and Why It Matters
Historical SEO data is really a stack of connected metrics: queries, landing pages, clicks, impressions, click-through rate, average position, and the device and country splits behind them. Each one tells a different part of the story, and losing any of them breaks the chain you need for reliable analysis.
- Forecasting timelines. You can’t credibly promise a client “rankings improve in 90 days” without seeing how similar keywords moved historically.
- Seasonality detection. A traffic dip in July might be a real problem, or it might be the same dip you saw last July.
- Update attribution. Comparing performance before and after a known algorithm rollout tells you whether a drop is Google’s doing or a technical mistake on your end.
- Growth validation. Year-over-year comparisons confirm whether your gains are real progress or just seasonal noise repeating itself.
Get these four right and you stop guessing at “why did this happen” and start answering it with a chart.
Where To Find Historical SEO Data
Three sources cover almost every practical need, and each has a different tradeoff between authority, depth, and cost.
- Google Search Console. The authoritative source for your own site’s actual clicks, impressions, and position data straight from Google. Its weakness is retention. Once data ages past the rolling window, it’s gone from the UI.
- Commercial historical SERP and keyword datasets. Providers like DataForSEO sell retrospective SERP snapshots and keyword metric histories, useful when you need to reconstruct what a competitor’s rankings looked like two years ago, not just your own.
Match the source to the question. Use GSC for your own site’s ground truth, vendor databases for trend context across many sites, and commercial datasets when you need a competitive retrospective GSC simply can’t provide.
Retention and Export Limits You Need To Plan Around
The gotchas that trip up most historical analyses aren’t exotic. They’re the basic limits everyone forgets until a year-over-year report comes up short.
- The 16-month rolling window. GSC’s UI caps performance history at 16 months, which quietly breaks any comparison older than that unless you exported ahead of time.
- The 1,000-row UI export cap. Pull a CSV straight from the GSC dashboard and you’re capped at 1,000 rows, nowhere near enough for a site with thousands of queries.
- API access up to 50,000 rows. The Search Console API raises that ceiling considerably, but it still requires you to build or schedule the pull yourself.
- Backfill isn’t automatic. Practitioners on Google’s own support forums report that bulk export to BigQuery doesn’t always backfill historical data as expected. It typically starts capturing from the export date forward.
Statistic to remember: GSC’s 16-month retention window is the hard ceiling on how far back your native GSC data reaches. Any year-over-year comparison beyond that requires data you preserved yourself, not data you can retrieve later. Check our glossary on Google Search Console if you need a refresher on how GSC structures its reports before you build an export pipeline around them.
How To Collect and Preserve Historical Data Step by Step
Building a durable historical dataset isn’t complicated, but it does require doing things in the right order.
- Export your maximum available range now. Pull everything GSC currently shows in the UI or via API before the rolling window advances further.
- Run an API backfill for the full 16 months. The API gives you row limits far beyond the UI’s 1,000-row cap, so use it for anything beyond a quick spot check.
- Schedule recurring pulls. Set up a daily or weekly job so each new day of data gets captured before it ages out. Practitioners commonly wire the GSC API directly into BigQuery and schedule pulls to accumulate a rolling archive that grows past the native window.
- Choose a durable storage pattern. BigQuery, a cloud storage bucket, or a vendor platform that stores extended GSC history all work, spreadsheets do not scale past a few properties.
- Lock down your schema early. Keep date, query, page, device, country, clicks, impressions, CTR, and position as consistent fields from day one, retrofitting a schema later means reprocessing everything you’ve already collected.
- Flag preliminary data. GSC’s most recent few days are provisional and can shift, so tag those rows and reconcile them once they finalize.
Our step-by-step export guide walks through the mechanics of setting this up if you’re starting from scratch.
Pro Tip: Back up your last available 16-month window as a static, timestamped file the day you read this. Even a messy CSV snapshot beats a perfect pipeline you didn’t build in time.

Turning History Into Forecasts and Diagnoses
Once you have the data preserved, the real work starts: turning a spreadsheet of dates and numbers into a forecast you’d actually defend to a client or a boss.
- Model ranking velocity by keyword cohort. Group similar keywords together (by intent, difficulty, or content type) and measure how fast each cohort historically moved from page two to page one. Historical keyword ranking data is what makes SEO forecasting defensible instead of a guess, because it replaces “rankings usually improve in a few months” with an actual pace drawn from your own past cohorts.
- Measure volatility with a rolling window. Calculate variance over trailing 30 or 90 day windows rather than reacting to single-day swings. A page that drops five positions for three days and recovers isn’t a crisis, it’s noise inside normal volatility.
- Overlay external signals. Layer Google Trends data and known algorithm update dates on top of your ranking timeline to separate demand-side shifts from site-level problems. Our partner resource on how algorithm updates affect traffic is a useful reference when you’re trying to date a suspected update against your own drop.
The value of historical ranking data isn’t the history itself, it’s what it lets you rule out. A drop that lines up with a confirmed algorithm rollout across dozens of sites is a different problem than a drop that’s isolated to one page on your own domain.
Annotating your timeline with known update dates and site changes turns this from a guessing exercise into pattern matching, and it’s the same principle behind features like custom annotations for tracking site changes.
A Compact End-to-End Historical Analysis You Can Run Today
Here’s a workflow that fits in an afternoon, using a single campaign or content cluster as the test case.
- Pick a scope. Choose 10 to 20 pages or keywords tied to one topic cluster, not your entire site.
- Export the full history you have. Pull GSC data for that scope across your maximum available range.
- Plot clicks, impressions, and average position on the same timeline. Look for the point where lines diverge, that’s usually where the real story is.
- Overlay known update dates and any site changes (redesigns, migrations, content edits) on the same chart.
- Check CTR against position independently. A page holding position but losing CTR usually points to a SERP feature or a title/meta issue, not a ranking problem.
- Form one hypothesis and test it. Fix the single most likely cause, then watch the next 30 to 60 days of data against your historical baseline.
Pro Tip: Don’t fix five things at once and call it a test. Change one variable, watch the historical trend line respond, and you’ll actually know what worked.
SERPView: Supporting Multi-Year Historical Workflows
Everything above works whether you build it yourself or use a platform designed around it. Serpview was built specifically to remove the friction from that pipeline.
- Consolidates GSC data across multiple properties in one dashboard, so you’re not exporting 15 sites individually.
- Supports exports up to 50,000 rows, well past the UI’s 1,000-row cap and closer to what a real historical analysis needs.
- Handles automated backfill and extended storage, so you’re not manually rebuilding a BigQuery pipeline from scratch.
- Includes built-in visualizations for content decay, CTR benchmarking, and algorithm update overlays, the exact diagnostics covered above.
| Point | Details |
|---|---|
| GSC’s ceiling is real | The 16-month retention window and 1,000-row UI export cap both limit native GSC analysis. |
| Backfill early | API backfill and scheduled pulls prevent gaps that break year-over-year comparisons. |
| Serpview removes the manual work | It consolidates multi-property GSC data and supports exports up to 50,000 rows with automated backfill. |
Cleaning Up Historical SEO Data Before You Trust It
A historical dataset is only as useful as it is clean, and multi-year SEO data collects a specific set of problems worth watching for.
Deduplicate overlapping exports. If you’ve pulled the same 16-month window twice, from a manual CSV and later an API backfill, you’ll get overlapping dates with slightly different row counts due to sampling. Reconcile by date and query before merging.
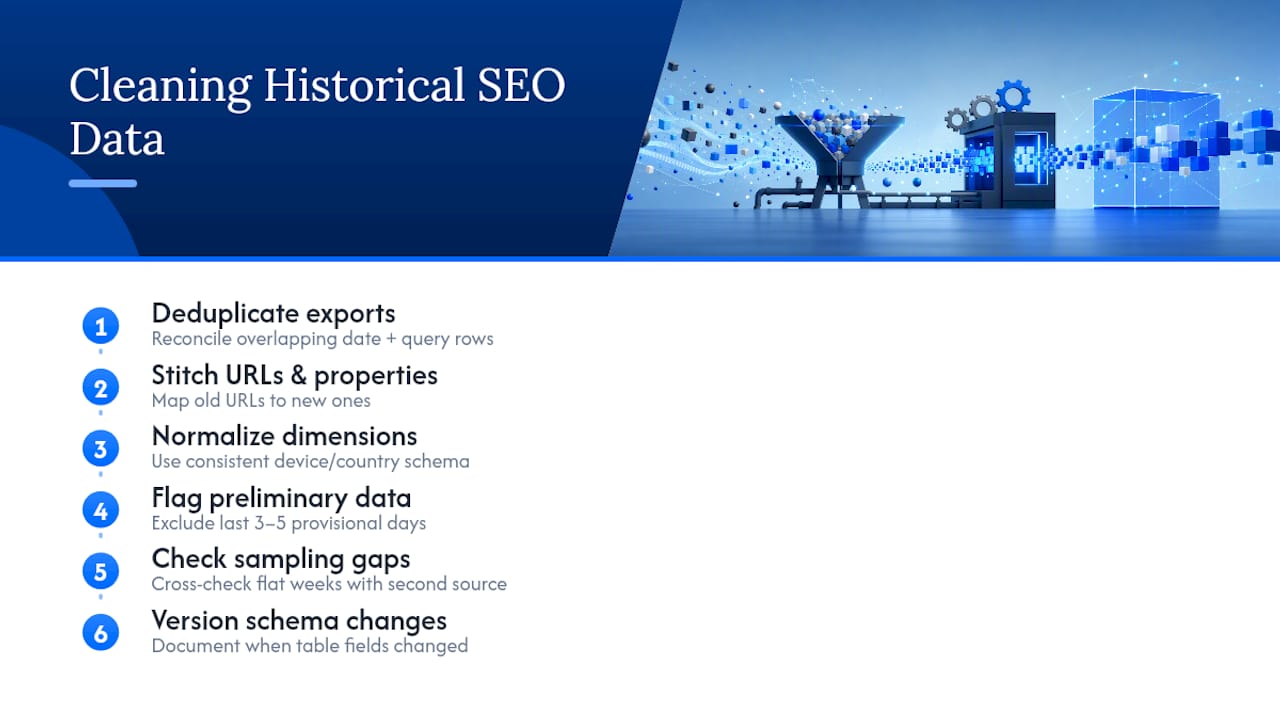
Watch for URL and property changes. A domain migration, HTTPS switch, or subdomain consolidation splits your historical data across two “properties” in GSC’s eyes. Stitch these together manually by mapping old URLs to new ones, or your trend lines will show a fake cliff on migration day.
Normalize device and country dimensions consistently. If one export segments by device and another doesn’t, you can’t compare them cleanly. Decide on your dimensions upfront and keep every future pull consistent with that schema.
Flag and reconcile preliminary data. GSC’s most recent days are provisional and can shift by the time they finalize, so never treat the last three to five days as settled numbers in a trend chart.
Check for sampling gaps, not just missing rows. A week with suspiciously flat, round numbers might indicate a failed pull rather than genuinely flat performance. Cross-check against a second source when a week looks unusually clean.
Version your schema changes. If you add a new field or restructure your table six months in, document exactly when that changed so future analysis doesn’t silently misread pre-change rows as post-change ones.
Privacy and Compliance When Handling SEO Data
Search performance data is aggregate and doesn’t include personal search queries tied to individual searchers, but that doesn’t mean it’s compliance-free. If your organization operates in the European Union or serves EU residents, GDPR governs how you store and process any data pipeline touching user-adjacent metrics, and that includes exported search data sitting in a cloud warehouse.
Access control matters more than most teams realize. A BigQuery instance holding years of multi-client search history is a liability if every team member has blanket read access. Scope permissions by property or client, and audit who can export raw data versus who only needs dashboard views.
If you manage historical data for multiple clients as an agency, contractual data ownership needs to be explicit. Clarify in writing whether historical performance data belongs to the client or stays with your agency after a contract ends, because a client asking for their full historical export mid-dispute is not the moment to discover you never addressed this.
Retention policy should be a deliberate choice, not a default. Keeping data indefinitely “just in case” increases your compliance surface without necessarily adding forecasting value beyond three to five years back. Decide how long you actually need multi-year history for forecasting purposes and set a policy accordingly, rather than accumulating everything forever by default.
Where Historical SEO Data Can Mislead You
Historical data is powerful, but it’s not a neutral record of the truth. It carries its own distortions, and treating it as gospel is how forecasts go wrong.

Algorithm changes retroactively affect how “comparable” old data really is. A ranking pattern from two years ago reflects a different Google than the one ranking pages today, so extrapolating old velocity onto a current forecast assumes stability that may not exist.
Sampling and estimation vary by vendor. Vendor historical databases don’t all measure the same way; one platform’s month-over-month keyword position might be sampled weekly while another samples daily, and comparing the two as if they’re equivalent introduces silent error.
Survivorship bias skews competitive retrospectives. If you’re studying “what worked” by looking at pages that currently rank well, you’re not seeing the pages that tried the same tactics and failed, which quietly inflates how effective a strategy looks in hindsight.
Small sample sizes create false confidence. A keyword cohort of five terms showing a clean upward trend can look like a reliable pattern when it’s really just five data points, one outlier away from telling a completely different story.
Correlation with external events is easy to overstate. A traffic increase that coincides with an algorithm update might really be seasonal demand, a competitor’s outage, or a link you built four months earlier finally getting crawled. Historical data shows you what happened together, not necessarily what caused what.
Tools Worth Considering for Deeper Historical Analysis
Once your data is clean and preserved, the analysis layer is where the real forecasting work happens, and the right tool depends on how far back you need to look and how many properties you’re managing.
For teams managing more than a handful of properties, a consolidated platform beats stitching together spreadsheets. Serpview’s extended storage for Search Console data is built specifically to hold multi-year GSC history across properties without the 1,000-row export ceiling that limits the native dashboard.
For raw data engineering, BigQuery paired with a scheduled GSC API pull remains a solid do-it-yourself option, particularly if your team already has data engineering resources and wants full control over schema design.
For competitive and industry-wide historical context beyond your own properties, commercial SERP history providers fill the gap that GSC and most vendor rank trackers can’t, since they reconstruct what competitor rankings looked like at a specific point in the past rather than only tracking what you’ve monitored yourself.
For automation and anomaly detection layered on top of historical trends, pairing your data pipeline with AI-driven search automation can flag unusual pattern breaks faster than manual chart review, especially useful once you’re monitoring dozens of keyword cohorts simultaneously.
Priorities for Building a Historical Dataset That Actually Holds Up
Get the first 30 days right by exporting everything available and setting up automated pulls, that alone prevents most of the data loss teams regret later. By 90 days, your schema should be stable and your storage pattern proven. By 365 days, you’ll have a genuine year-over-year baseline instead of a guess.
Why Serpview Fits This Workflow
Everything covered here, backfilling GSC before the window closes, scheduling automated pulls, building a clean multi-year schema, comes down to one problem: doing it manually takes real engineering time most SEO teams don’t have to spare. Serpview solves the underlying constraint directly. Instead of hitting GSC’s 1,000-row UI cap or building your own BigQuery pipeline, you get consolidated multi-property data with exports up to 50,000 rows, plus automated backfill so history keeps accumulating without a recurring manual job.

That matters most for agencies and multi-site teams who need year-over-year comparisons across dozens of properties without stitching together spreadsheets from five different exports. If you’re managing client reporting, Serpview’s white-label dashboards turn that preserved history into client-ready reports without extra formatting work. Explore how Search Console data connects to broader search terms in Serpview’s glossary, then start a trial to see your own multi-year history populate automatically.
Sources
FAQ
What Counts as Historical SEO Data?
It’s the time-series record of your queries, clicks, impressions, click-through rate, and average position tracked by date, device, and country, the raw inputs for forecasting and trend analysis.
How Far Back Does Google Search Console Keep Data?
GSC retains a rolling 16 months of performance data in its interface, and anything older is lost unless you exported or backfilled it first.
What’s the Export Row Limit in GSC?
The UI caps CSV exports at 1,000 rows, while the API supports pulls up to 50,000 rows, which is why most teams use the API or a platform like Serpview for full-scale exports.
Does BigQuery Export Automatically Backfill Old Data?
No. Bulk export to BigQuery typically starts capturing data from the export date forward rather than pulling in your full historical window automatically.
Can Historical Data Actually Improve Forecasting Accuracy?
Yes. Modeling ranking velocity from historical keyword cohorts replaces generic timeline guesses with pace estimates based on how similar keywords actually moved in the past.
Recommended
Ready to unlock your full GSC potential?
SERPView helps you access all your Google Search Console data without limitations. Start your free trial today.
Get Started Free