
15 Minutes a Week: Agency Search Console Rankings, Bulk Export
SERPView Team
SEO Analytics

Use Google Search Console’s Performance report with Average position enabled as your canonical source for ranking trends, and view it alongside impressions and clicks rather than in isolation. Position tells you where you rank; clicks and impressions tell you whether that ranking matters. When you need row-level detail beyond the UI’s limits, export to BigQuery or pull data through the API.
TL;DR:
- Tracking rankings relies on the combined view of average position, impressions, and clicks, with all four metrics active in Search Console for a complete picture.
- Filtering by specific queries, pages, devices, and regions enhances trend accuracy, while exporting data beyond the UI limits helps with long-term and detailed analysis.
- Use a 28-day comparison window to catch real shifts without reacting to daily or preliminary fluctuations, and flag significant drops or low-CTR queries during weekly reviews.
- Export data to BigQuery to overcome Search Console’s 1,000-row limit, retain long-term history, and join with GA4 for insights into post-click behavior.
- Consolidating data across multiple properties with tools like SERPView streamlines analysis, reduces manual effort, and helps spot long-tail queries and cannibalization issues at scale.
Table of Contents
- How to Track Rankings in Search Console Step by Step
- What Do Clicks, Impressions, CTR, and Position Actually Mean?
- Where Search Console’s Data Falls Short (and How to Work Around It)
- What Should Your Weekly Ranking Check Look Like?
- How Do You Export Search Console Data to BigQuery and Join It with GA4?
- Running Search Console Across Multiple Properties Gets Messy Fast
- When the Search Console UI Stops Being Enough
- Sources
- FAQ
How to Track Rankings in Search Console Step by Step
Getting Average position onto your screen takes about ten seconds. Getting the right view of it, filtered, dated, and compared against a prior period, takes a bit more intention. Here’s exactly what to click.
Turn on the metrics that matter
Open Performance in the left sidebar of Search Console, then look at the four toggle buttons above the chart: Total clicks, Total impressions, Average CTR, and Average position. Only clicks and impressions are on by default. Click the other two so all four are active.
With all four visible, you get the full picture in one chart: how often a page or query showed up (impressions), how often people clicked (clicks), the ratio between them (CTR), and where you rank on average (Average position). Google itself recommends weighting impressions and clicks as heavily as position, because position alone can mislead you when volume is thin or a query is rarely triggered.
Choose the right tab: Queries vs Pages
Below the chart, Search Console splits data into tabs: Queries, Pages, Countries, Devices, Search appearance, and Dates. Two of these do most of the work:
- Queries tab shows every search term that triggered an impression for your site, along with its own clicks, impressions, CTR, and position.
- Pages tab shows the same four metrics rolled up by URL.
Here’s the practical distinction most guides skip: page-level analysis tells you which asset is underperforming, while query-level analysis tells you why. If a page’s average position looks fine but clicks are flat, click into that page and check its queries. You’ll often find one query dragging the average down while three others perform well. This page versus query analysis is the single habit that separates a shallow ranking check from a useful one.
Set your date range and turn on Compare
Click the date selector and choose Compare, then pick “Last 28 days vs previous period.” Twenty-eight days is long enough to smooth out weekday noise but short enough to catch a real shift before it compounds. For a longer trend line, switch the chart granularity to weekly or monthly, which reduces the jagged daily spikes that come from preliminary, not-yet-finalized data points.
Build filters you’ll reuse
Filters live just above the data table, and saving the right combinations turns a five-minute scroll into a ten-second glance:
- Query filter, exclude branded terms so branded traffic doesn’t mask how your non-branded rankings are actually trending.
- Device filter (mobile, desktop, tablet), since average position and CTR frequently diverge by device.
- Country filter, useful if you serve multiple markets and one region’s rankings are dragging the aggregate.
- Search type filter (Web, Image, Video, News) to isolate rankings that only apply to standard web search.
Save the filtered views you check weekly rather than rebuilding them from scratch each time.
Know when to export, and how
The UI table caps out at 1,000 rows, and that ceiling shows up fast on any site with real query volume. For a quick list, the export button above the table (top right) pushes data straight to Google Sheets, Excel, or CSV, fine for a one-off spot check.

Once you’re regularly hitting that 1,000-row wall, or you need query-level history beyond a few weeks, switch to bulk export or the Search Console API, which pull row-level data without the truncation the UI applies to large query sets. That distinction, small export for a spot check versus bulk export for ongoing analysis, is where most teams either save themselves hours or waste them.
What Do Clicks, Impressions, CTR, and Position Actually Mean?
Each metric answers a different question, and mixing them up leads to bad conclusions.
- Impressions: how many times a URL from your site appeared in search results, even if the user never scrolled to see it.
- Clicks: how many times someone clicked through to your site from that impression.
- CTR (click-through rate): clicks divided by impressions, expressed as a percentage.
- Average position: the average ranking position of your site across every impression in the selected period, averaged, not a single fixed rank.
That last point matters more than it sounds. If your page ranks #2 for one search and #14 for another version of the same query, your average position lands around 8, a number that describes neither result accurately. This is why Google’s own guidance on average position pushes you to treat it as directional context, not a precise ranking snapshot.
Chart totals and table totals won’t always match, and this trips up more analysts than any other quirk in the tool. The chart at the top of the Performance report aggregates at the property level, meaning it reports your site’s topmost position for a query and deduplicates clicks and impressions across pages. The table beneath it, when you’re viewing by page, counts each URL separately.
Say a query surfaces two of your pages in the same results page, one at position 4 and one at position 11. Property-level aggregation in the chart reports position 4 (your best-ranking page) and counts the impression once. Page-level aggregation in the table counts both impressions separately and averages in that lower position 11 too. The result: your table can show a worse average position and a lower CTR than the chart implies, for the exact same query and date range.
Pro Tip: When you report a CTR or position change to a client or your team, always name which view you pulled it from, chart or table, property or page. Skipping that context is the single most common way ranking reports get miscommunicated.
Where Search Console’s Data Falls Short (and How to Work Around It)
Search Console is generous with insight but stingy with rows, and knowing its limits keeps you from drawing conclusions the data can’t support.
- Row caps and truncation: the table interface stops at 1,000 rows, and Google anonymizes rare or sensitive queries entirely, folding them into an unlabeled bucket. On a large site, this can hide meaningful long-tail decay simply because those queries never surface individually.
- Preliminary data: the newest one to two days of data can shift as Google finalizes processing, shown in the UI as a dotted line rather than a solid one. Reacting to a dip that’s still preliminary is a fast way to chase noise.
- The 16-month retention window: Search Console only keeps roughly sixteen months of history. If you need a longer baseline, comparing this year’s holiday season to two years ago, for instance, you need to have already exported that data before it aged out.
The fix for all three is the same: stop relying solely on the UI for anything beyond a quick check. Set up a daily bulk export to BigQuery or query the API on a schedule, and you remove the row cap, preserve history past sixteen months, and build your own smoothing on top of the raw data instead of eyeballing a chart. For day-to-day interpretation, favor weekly or monthly views over daily ones, and set a conservative threshold, a shift over multiple weeks, not a single day, before you treat a position change as real.
Pro Tip: If a query you know performs well simply isn’t showing up in your Queries tab, don’t assume it dropped out of the index. Check whether it’s been folded into Search Console’s anonymized-query bucket before you panic.
What Should Your Weekly Ranking Check Look Like?
A ranking review doesn’t need to eat your afternoon. Fifteen minutes, run the same way every week, catches more than an occasional deep dive.
- Set the date range to the last 28 days, compared to the prior 28. This window is short enough to catch emerging problems and long enough to ignore daily jitter.
- Sort the Pages tab by impressions, then open the top pages and check which queries sit in positions 5 through 15. That range is your highest-leverage zone: pages already visible enough to rank on page one or near it, but not yet capturing the clicks they should.
- Flag high-impression, low-CTR queries. A query pulling 50 or more impressions with a CTR well below your site’s benchmark is a signal to test a new title tag or meta description, not to rewrite the page.
- Flag sustained drops. A query or page that has fallen more than five positions over four straight weeks deserves investigation. A one-week dip usually does not.
- Log every finding with a next action. A spreadsheet row that says “position dropped” without a follow-up task is wasted observation.
Pro Tip: Un-targeted queries already sending impressions to a page you didn’t optimize for them are often the fastest wins available. Filter Page → Queries on your best-performing pages and you’ll usually find at least one.
How Do You Export Search Console Data to BigQuery and Join It with GA4?
The UI answers “how are we ranking.” It cannot answer “what happened after the click,” and that gap is where most ranking analysis quietly runs out of runway. Closing it means exporting to BigQuery and joining against GA4.
Enable bulk export from Search Console’s settings, which streams daily query and URL-level rows into a BigQuery dataset you control, no 1,000-row ceiling, no anonymization bucket swallowing your long tail. One catch worth flagging up front: exports begin the day you turn them on and do not backfill history, so enabling this sooner rather than later pays off later.
Before joining Search Console rows to GA4 events, normalize both datasets:
- Canonicalize URLs by stripping UTM and other tracking parameters consistently on both sides, or the join will silently drop matches.
- Align timezones. Search Console reports in Pacific Time; GA4 reports in whatever timezone your property is configured with. A mismatch here skews any day-level join.
- Expect approximation, not certainty. Session attribution and query-value allocation are estimates, not measured ground truth, since GA4 doesn’t know which exact query drove a given session the way Search Console records it.
Once joined, this workflow typically surfaces three things: queries that generate impressions but never appear in your landing-page reports (a targeting gap), pages that rank well but show no corresponding GA4 sessions (a tracking gap), and outcome estimates you can allocate back to individual queries for reporting. None of that is visible from the Performance report alone, which is precisely why teams running multiple properties tend to outgrow the native export tools fairly quickly.
Running Search Console Across Multiple Properties Gets Messy Fast
Anyone who has managed rankings for more than two or three properties at once knows the real bottleneck isn’t understanding the metrics, it’s the friction of checking each one separately. Every property means a separate login, a separate set of saved filters, and a separate export to reconcile against last month’s numbers. Multiply that by a dozen client sites and “quick weekly check” turns into a half-day chore. Centralizing that view, rather than tabbing between a dozen instances of the same report, is what actually makes a weekly ranking routine sustainable at scale.
— Utsav Chopra
When the Search Console UI Stops Being Enough
Everything above works inside Google’s own interface, and for a single property, it’s often enough. The friction shows up the moment you’re managing several properties at once: separate logins, separate row caps, separate exports that need manual reconciling before you can compare one client’s trend against another’s.
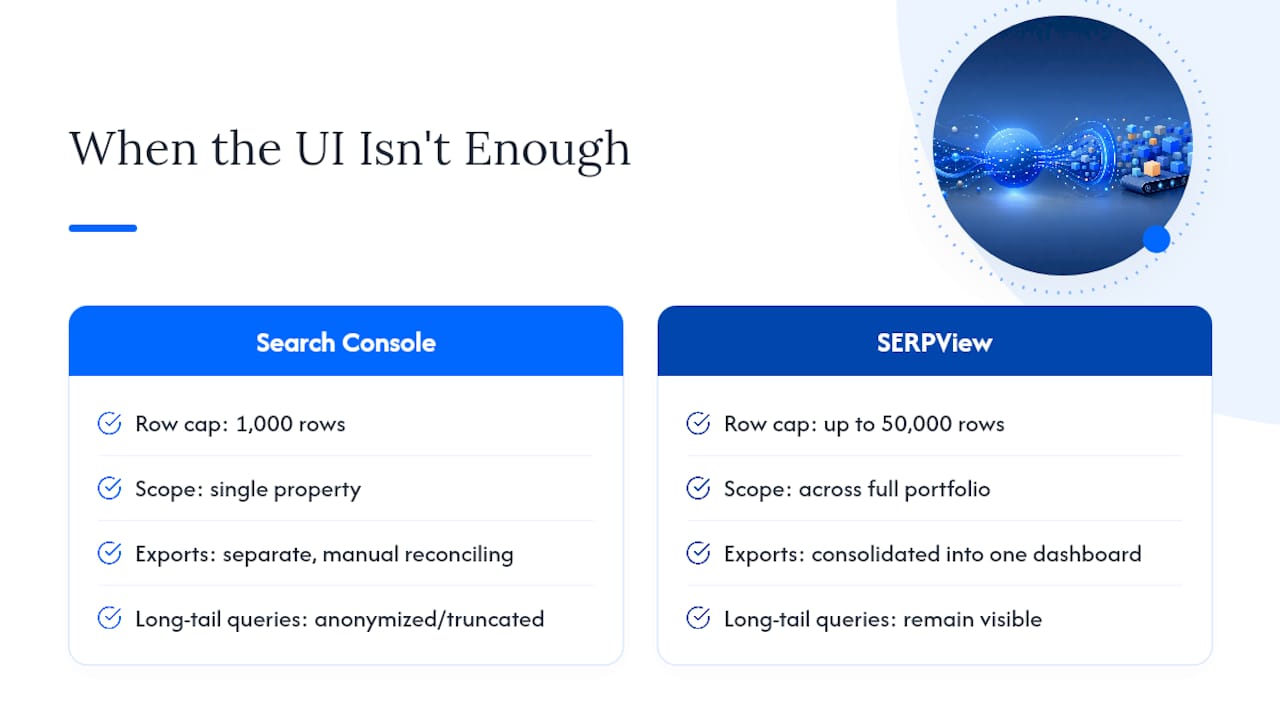
That’s the specific gap SERPView closes. It consolidates Search Console data across every property you manage into one dashboard, with access to up to 50,000 rows instead of the UI’s 1,000-row ceiling, so the long-tail queries Search Console anonymizes or truncates stay visible. The workflows covered above, page versus query analysis, flagging positions 5 through 15, spotting CTR gaps, map directly onto SERPView’s query counting and cannibalization reports, but across your full portfolio instead of one property at a time. Agencies get white-label, client-ready dashboards instead of manually rebuilt spreadsheets every Monday. If your weekly ranking check has started eating more than fifteen minutes, that’s the sign it’s time to look at a consolidated view.
Sources
- Performance report (Search results): Overview and basic setup - Search Console Help
- What GA4 and Search Console Will Never Tell You (And How to Get It Anyway)
FAQ
How do you track search engine rankings?
Enable Average position in Search Console’s Performance report and view it alongside clicks and impressions over a 28-day window. For row-level or long-term tracking beyond the UI’s limits, export via the API or bulk export to BigQuery.
Is 75 a good SEO score?
Search Console doesn’t produce a single SEO score, so judge your actual performance by trends in impressions, clicks, CTR, and average position instead of a composite score.
What does Google Search Console actually track?
Search Console tracks how your site appears in Google Search results: impressions, clicks, click-through rate, and average position, broken down by query, page, country, device, and search type. It also reports indexing status and technical issues affecting visibility.
How do you check keyword ranking in Google Search Console?
Open the Performance report, enable Average position, and use the Queries tab to see each search term’s position, clicks, and impressions. Filter by date range and device for a clearer read, and switch to the Pages tab when you need to diagnose a specific URL’s query mix.
What’s the difference between page-level and query-level analysis in Search Console?
Page-level analysis rolls metrics up by URL and shows which asset is underperforming; query-level analysis shows which specific search terms are driving or dragging that page’s numbers. Checking both, rather than one or the other, is what page vs query analysis in Search Console is built around.
Recommended
Ready to unlock your full GSC potential?
SERPView helps you access all your Google Search Console data without limitations. Start your free trial today.
Get Started Free