
Cross-Domain Keyword Analysis: A Practical Agency Guide
SERPView Team
SEO Analytics
Cross-domain keyword analysis is the practice of consolidating and comparing keyword performance data across multiple websites or Search Console properties so you can see which queries each domain ranks for, where they overlap, and which domain earns the clicks. The recommended approach is straightforward:
- Use domain-level GSC properties wherever you control the full domain, so subdomains and protocols roll up automatically.
- Export data via the API, BigQuery, or CSV rather than relying on the web UI, which caps results at 1,000 rows.
- Deduplicate and compare by query string across domains to identify shared queries, unique queries, and which property wins each impression.
The outcome is a consolidated view that shows shared vs. unique queries per domain, click and impression attribution, and the ranking URL responsible for each result.
Key Takeaways
Cross-domain keyword analysis works when you unify GSC data under consistent property types, apply a documented counting rule, and compare shared queries by impressions, clicks, and CTR across domains.
| Point | Details |
|---|---|
| Use domain properties by default | Domain properties capture all subdomains and protocols, reducing normalization work. |
| Export beyond the UI | The GSC web UI caps at 1,000 rows; use the API or BigQuery to access full query sets. |
| Document your counting rule | Decide per-domain vs. global counting before deduplication to keep attribution consistent. |
| Prioritize by impression-CTR gap | Rank shared queries by impressions multiplied by CTR delta to find the fastest wins. |
| Serpview for portfolio scale | Serpview consolidates multiple GSC properties with up to 50,000 rows and pre-built cross-domain reports. |
Table of Contents
- When does cross-domain keyword analysis actually pay off?
- Which data sources and Search Console property types should you use?
- How to run the analysis from start to finish
- What metrics actually matter for cross-domain comparisons?
- Common pitfalls and how to avoid them
- Which tools fit which portfolio size?
- What does setup actually cost in time and money?
- Three tactical plays you can run from your findings
- The data-first approach most agencies skip
- Serpview makes cross-domain analysis repeatable at scale
- Sources
- FAQ
When does cross-domain keyword analysis actually pay off?
Not every portfolio needs a full cross-domain audit every month. The analysis delivers the clearest ROI in specific situations:
- Multi-brand portfolios where two or more owned domains target overlapping topics and you need to know which one Google prefers for each query.
- International or multilingual sites split across ccTLDs or subdomains, where you want to confirm language targeting is working and traffic is not leaking between properties.
- Site migrations where you need to verify that the destination domain has absorbed the source domain’s query visibility within a defined recovery window.
- Cannibalization audits across separate domains, not just within a single site, using a tool like Serpview’s keyword cannibalization checker.
- Content consolidation projects where two sites cover the same topic and you want data to decide which URL to keep, redirect, or merge.
Agencies with multiple client sites and enterprise SEO teams managing ecommerce networks or publisher portfolios benefit most. A migration recovery check, for example, can surface within two weeks whether the new domain is picking up the old domain’s branded queries — a quick, high-value signal that guides redirect and content decisions immediately.
Which data sources and Search Console property types should you use?
Choosing the right property type before you export saves hours of normalization work later.
Google recommends domain properties as the default for consolidated analysis. A domain property for example.com captures data across www.example.com, m.example.com, all subdomains, and both HTTP and HTTPS. Verification requires a DNS TXT record, which means you need registrar access. URL-prefix properties, by contrast, track only the exact protocol and path you specify — useful when you intentionally want to isolate a language subpath like /en/ or /es/ or a specific subdomain without aggregating the rest of the domain.
Pro Tip: If you manage a site where blog.example.com and shop.example.com serve different business units with separate reporting needs, create URL-prefix properties for each subdomain in addition to the domain property. You get the consolidated view from the domain property and the isolated view from the prefix properties.
Beyond website properties, Search Console also supports platform properties for YouTube, Instagram, and X, which matter when your client’s video or social content ranks alongside their web pages for the same queries.
For export, your main options are:
- BigQuery bulk export, which supports multiple properties into a single Cloud project with custom dataset names per property.
How to run the analysis from start to finish
Follow this sequence and you can hand it to a junior analyst as a repeatable runbook:
- Inventory all properties. List every domain, subdomain, and platform property in scope. Note the property type (domain vs. URL-prefix) and verification status.
- Choose property types. Default to domain properties. Add URL-prefix properties only where you need segmented data.
- Set a consistent date range. Use the same start and end date for every property. Mismatched ranges are one of the most common sources of misleading comparisons.
- Export data. For portfolios under roughly 150 domains, a scripted Google Sheets and GSC API approach works well. For larger portfolios, use BigQuery bulk export.
- Normalize dimensions. Standardize query strings to lowercase, strip trailing spaces, and align country and device filters across all exports.
- Deduplicate queries. Decide your counting rule before this step (see the Pro Tip below). Then flag each query as shared (appears in two or more domains) or unique (appears in only one).
- Attribute query-to-domain. For each shared query, record which domain holds the higher average position and which URL ranks.
- Compute comparison metrics. Calculate impressions, clicks, CTR, and average position per domain per query.
- Act on findings. Prioritize shared queries with the largest impression gap between domains.
Pro Tip: Decide your query counting rule before you deduplicate. Per-domain counting credits each domain independently for every impression and click it receives for a query, giving you a true picture of each property’s performance. Global counting treats a query as a single unit and assigns it to the dominant domain. Per-domain counting is usually the right default for cross-domain comparison; global counting is better for portfolio-level share-of-voice reporting.
What metrics actually matter for cross-domain comparisons?
Once your data is unified, these are the dimensions worth comparing:
| Metric | What to compare across domains |
|---|---|
| Impressions | Which domain gets more search exposure for shared queries |
| Clicks | Which domain converts impressions into traffic |
| CTR | Whether a lower-ranking domain punches above its position |
| Average position | Ranking gap between domains for the same query |
| Query overlap | Count of shared queries vs. queries unique to each domain |
| Ranking URL per domain | Which page on each domain holds the ranking |
| SERP feature presence | Which domain earns rich results, sitelinks, or knowledge panels |
| Device split | Whether one domain over-indexes on mobile vs. desktop |
| Country split | Whether traffic attribution differs by market |
| Trend / delta | Whether one domain is gaining or losing ground over time |
For visualization, heatmaps work well for showing query overlap at scale. Stacked bar charts communicate share of clicks across domains clearly for stakeholder presentations. Per-query tables with ranking URLs per domain are the most useful format for tactical decisions.
Common pitfalls and how to avoid them
These mistakes produce misleading conclusions or wasted analyst hours:
- GSC UI row caps. The web UI shows a maximum of 1,000 rows. Long-tail queries — often the most revealing for cross-domain overlap — are hidden. Export via API or BigQuery to access the full dataset. Serpview’s search data blind spots guide covers this in detail.
- Canonical and subdomain confusion. If
www.example.comandexample.comare both verified as URL-prefix properties, you may double-count data that a domain property would unify. Audit your property list before exporting. - Inconsistent date ranges. Comparing January data for one domain against February data for another produces noise, not insight. Lock the date range in your export script.
- Attribution errors. When a query appears in two domains, both may show impressions. Document your counting rule and apply it consistently so stakeholders understand what “Domain A owns this query” actually means.
- Mixing property types without normalization. A domain property and a URL-prefix property for the same site will overlap. Either exclude one or apply a filter to remove the overlap before merging.
Add a QA checklist to your runbook: verify row counts match expected export volume, confirm date ranges are identical, and spot-check five shared queries manually against the live SERP before finalizing the report.
Which tools fit which portfolio size?
The right stack depends on how many properties you manage and how often you need to refresh the data.
- Small portfolios (under 20 domains): Google Sheets with a GSC API Apps Script is the fastest path to consolidated reporting. The scripted approach can support around 150 domains before OAuth complexity and execution limits become a real constraint.
- Mid-to-large portfolios (20–200+ domains): BigQuery bulk export paired with SQL and Looker Studio scales well. You get daily data, full query sets without row caps, and a repeatable pipeline that runs without manual intervention.
- Enterprise portfolios: A dedicated SaaS dashboard that consolidates GSC data natively removes the engineering overhead of maintaining BigQuery pipelines and custom Looker Studio connectors.
Serpview sits in the third category and addresses the gap between raw GSC exports and a finished, repeatable reporting workflow. Its unified dashboard consolidates multiple GSC properties, exports up to 50,000 rows, and includes pre-built reports for cannibalization and CTR benchmarking. For agencies that need shared dashboards with white-label client access, that capability is built in rather than bolted on.
For AI-assisted keyword expansion alongside your cross-domain work, AI-powered keyword discovery methods can surface query clusters you may not have considered when building your initial inventory.
What does setup actually cost in time and money?
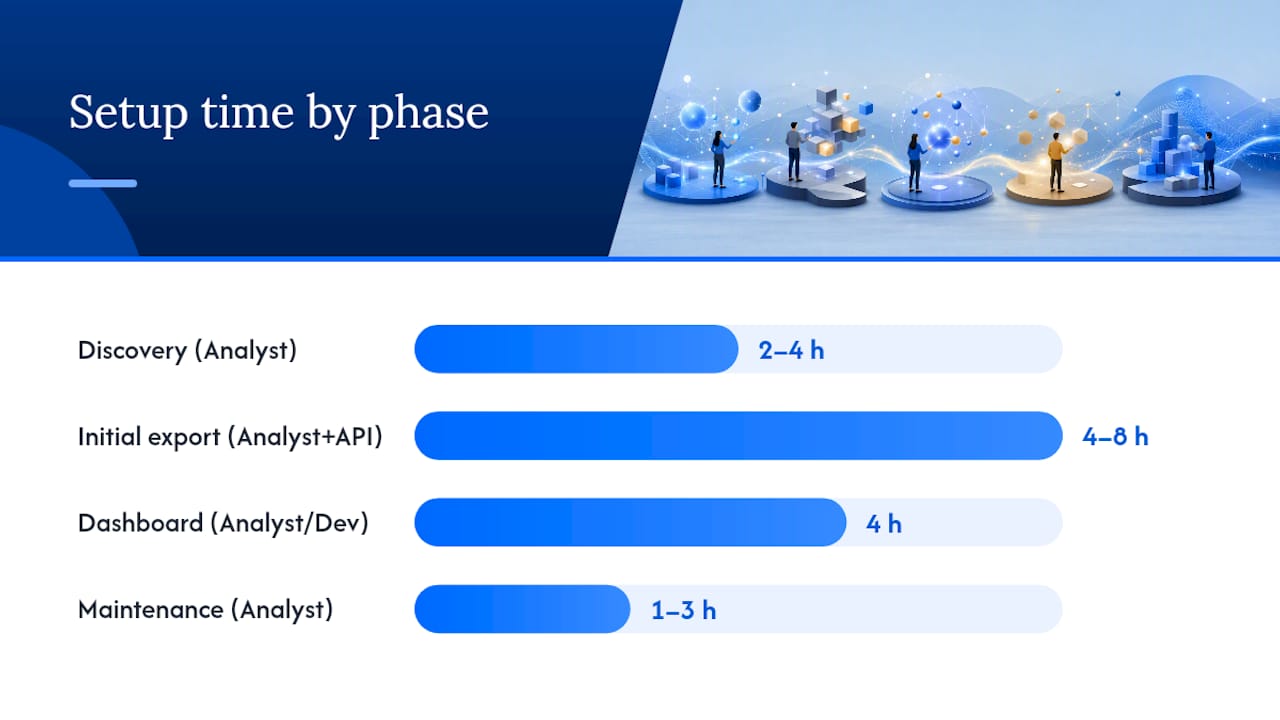
| Phase | Typical duration | Primary cost driver |
|---|---|---|
| Discovery and property inventory | 2–4 hours | Analyst time |
| Initial export and normalization | 4–8 hours | Analyst time + API quota |
| Dashboard or report build | 4 hours | Analyst or developer time |
| Recurring monthly maintenance | 1–3 hours | Analyst time |
BigQuery storage and query costs are generally modest for GSC data volumes, though they scale with the number of properties and query frequency. A SaaS subscription like Serpview replaces much of the build and maintenance time with a ready-made interface, which often makes it the more cost-effective option once a portfolio exceeds 10–15 properties.
Three tactical plays you can run from your findings
-
Consolidate duplicated pages. Identify shared queries where two domains rank for the same intent with similar content. Pick the stronger URL based on average position and clicks, redirect the weaker page, and monitor the winning domain’s impressions over the next 28 days. Use content groups to track topic-level performance before and after the consolidation.
-
Defend brand queries across domains. If a non-primary domain is ranking for your client’s branded queries and earning clicks that should go to the main site, create or strengthen branded content on the primary domain and use branded keyword tracking to monitor recovery. This is especially common after acquisitions where the acquired domain still holds brand equity.
-
Fix cross-domain canonical and internal linking gaps. When a secondary domain ranks higher than the primary for a shared query, check whether the primary domain has a canonical pointing to the secondary, or whether internal links are distributing authority incorrectly. Correct the canonical, add cross-domain internal links where appropriate, and track position delta over the next two crawl cycles.
For prioritization, rank shared queries by potential impressions multiplied by the CTR gap between domains. Queries with high impressions and a large CTR delta between Domain A and Domain B represent the fastest wins.
The data-first approach most agencies skip
Most cross-domain SEO advice focuses on architecture decisions — which domain to use, how to structure hreflang, whether to consolidate or keep separate sites. That advice is not wrong, but it skips the step that makes every subsequent decision defensible: building a unified query dataset first.

Agencies that run cross-domain keyword analysis before making structural recommendations can show clients exactly which queries are being split, which domain is losing clicks it should be winning, and what the measurable upside of consolidation looks like. That is a fundamentally different conversation than “we think these sites are cannibalizing each other.”
The other gap in standard advice is the counting rule decision. Most practitioners export data and merge it without documenting how shared queries are counted. That produces reports where the total impressions across domains exceed what Google actually served, and stakeholders lose confidence in the numbers. Deciding per-domain vs. global counting before you build the report is a small step that prevents a large credibility problem.
Start with domain properties, export everything, and document your counting rule. The analysis is only as trustworthy as the methodology behind it.
Serpview makes cross-domain analysis repeatable at scale
Managing cross-domain keyword analysis across a growing client roster means the data pipeline has to work every time, not just when someone remembers to run the script.

Serpview consolidates your Google Search Console properties into a single dashboard, exports up to 50,000 rows per report, and includes pre-built cannibalization and CTR benchmarking reports that map directly to the workflow above. Shared dashboards with white-label branding let you deliver client-ready views without rebuilding reports each month. Custom annotations help you mark migrations and algorithm updates so context is always attached to the data. If you manage more than a handful of properties and want analysis you can repeat without rebuilding the pipeline each time, start with Serpview and see the consolidated view in minutes.
Sources
- Announcing domain-wide data in Search Console | Google Search Central Blog
- Add a website or platform property to Search Console - Search Console Help
- Google Search Console Bulk Data Export To BigQuery Now Supports Multiple Properties
FAQ
What is cross-domain keyword analysis?
Cross-domain keyword analysis is the process of consolidating search performance data from multiple websites or GSC properties to compare which queries each domain ranks for, where they overlap, and which domain earns the clicks and impressions.
When should you use a domain property vs. a URL-prefix property?
Use a domain property when you want a unified view of all subdomains and protocols under one root domain. Use a URL-prefix property when you need to isolate a specific path, subdomain, or language segment for separate reporting.
How do you get around the GSC 1,000-row limit for cross-domain work?
Export data via the Search Console API or configure a BigQuery bulk export, which supports multiple properties in a single Cloud project and removes the row cap that the web UI imposes.
Which metric should you prioritize when comparing domains?
Start with shared queries sorted by impressions multiplied by the CTR gap between domains. That calculation surfaces the queries where one domain is underperforming relative to the other and where a fix will have the most measurable impact.
How does Serpview help with cross-domain keyword analysis?
Serpview consolidates multiple GSC properties into one dashboard, exports up to 50,000 rows, and includes pre-built cannibalization and CTR benchmarking reports, removing the need to build and maintain a custom BigQuery or Sheets pipeline for portfolio-scale analysis.
Recommended
Ready to unlock your full GSC potential?
SERPView helps you access all your Google Search Console data without limitations. Start your free trial today.
Get Started Free