
KPI-Driven SEO Reporting: A Practical 2026 Guide
SERPView Team
SEO Analytics
TL;DR:
- KPI-driven SEO reporting links one primary metric to business outcomes and supports decision-making. It structures reports into audience-specific tiers, focusing on revenue, growth, and operational health, with 5 to 9 KPIs overall. Serpview enables scalable, transparent dashboards and AI tracking, making KPI reporting sustainable at scale.
KPI-driven SEO reporting is a reporting discipline that selects one north-star KPI plus a small set of supporting metrics that directly connect organic search activity to business outcomes — revenue, pipeline, and cost efficiency — then delivers those numbers at audience-appropriate cadences. The verdict: if your reports lead with rankings and impressions, you are reporting SEO activity, not SEO value. The shift to KPI-driven reporting is what turns a monthly PDF into a budget-renewal conversation.
Here is where to start:
- Pick your north-star metric. For e-commerce, that is organic revenue. For B2B SaaS, it is organic-attributed pipeline or demo requests. For local businesses, it is phone leads or direction requests. Every report cover should open with this single number and its variance from target.
- Map several supporting KPIs across four categories: visibility and traffic, engagement and conversion, technical health, and AI search performance. Each supporting KPI must answer a specific business question, not just describe platform activity.
- Decide audience tiers and cadence. C-suite receives a quarterly revenue-impact summary. Marketing leadership gets a monthly growth report. Your SEO and dev team works from a weekly operational health snapshot. The data source is the same; the lens changes.
Your primary data sources for all three tiers are Google Search Console for query-level impressions and clicks, Google Analytics 4 (GA4) for sessions, conversions, and event-level attribution, and Serpview for consolidated multi-property dashboards that extend well beyond Search Console’s 1,000-row limit.
Table of Contents
- What does a KPI-driven SEO report actually contain?
- Which SEO KPIs actually belong in your report?
- KPI vs. metric: what is the real difference?
- How do you choose KPIs that align with business goals?
- How should you customize reports for different audiences?
- How do you measure SEO KPIs accurately across data sources?
- How do you put KPI-driven reporting into practice?
- Key Takeaways
- The reporting mistakes that actually cost you budgets
- Serpview makes KPI-driven reporting sustainable at scale
- Useful sources
- FAQ
What does a KPI-driven SEO report actually contain?
Every KPI-driven report shares a common structure, regardless of audience tier. The outline below differentiates reports that drive decisions from those that are overlooked.
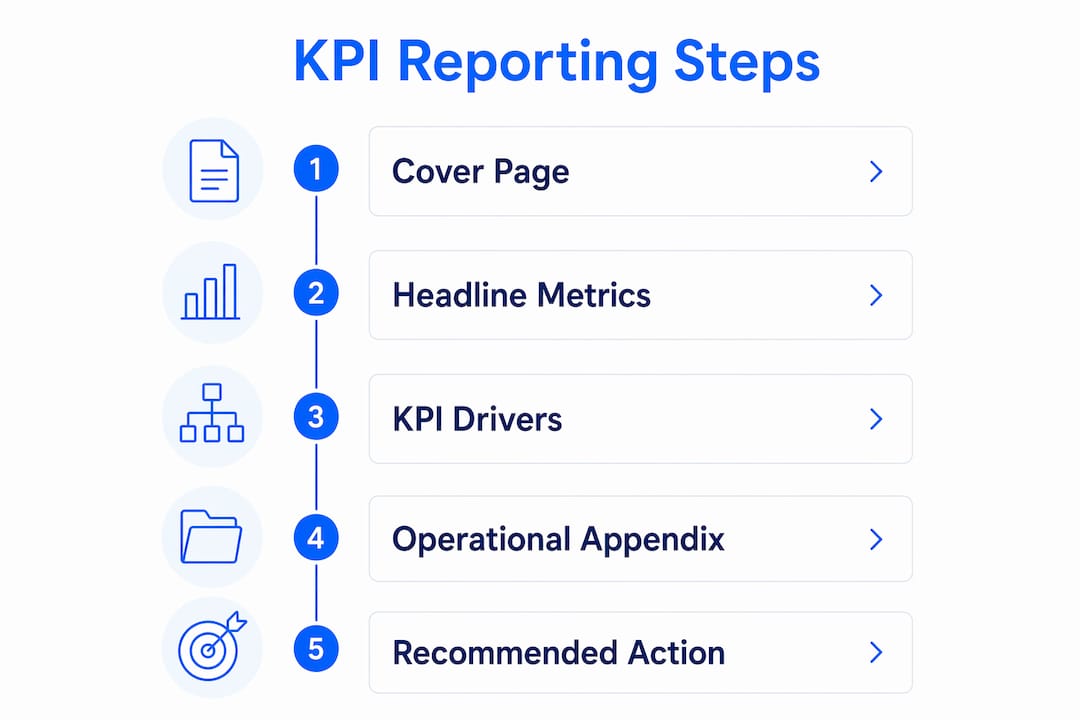
Cover page and executive summary. Page one shows the north-star metric, its value for the period, its variance from target, and a single one-line verdict: “Organic pipeline grew 18% quarter-over-quarter, exceeding target by 6 points.” Nothing else belongs on the cover. Stakeholders who read only one page should leave knowing whether the program is on track.
Headline section: business-impact metrics. This is where organic revenue, pipeline contribution, and cost-per-acquisition live. Present high-level trendlines (month-over-month and year-over-year) alongside variance from the agreed target. According to Search Engine Land, reports that lead with revenue and pipeline rather than rankings are far more likely to influence executive decisions. Keep this section to one slide or one page.
Driver section: supporting KPIs and diagnostics. This section explains why the headline moved. Non-branded search visibility, conversion rate by landing page, and AI citation share belong here. When an anomaly appears — a traffic drop, a conversion dip — include a one-slide diagnostic that names the cause and the fix. Vague anomalies without context erode stakeholder trust faster than a bad month of numbers.

Operational appendix. Core Web Vitals pass rates, crawl errors, indexation ratios, content publishing cadence, and backlink highlights go here. This section is written for the SEO and dev team, not the CFO. It should be detailed enough to act on but never appear in the executive summary.
Good data visualization practices matter throughout. Trendlines beat tables for executive slides; tables beat charts for the technical appendix where precision matters more than pattern recognition.
Pro Tip: Always close your report with a single recommended action tied to north-star movement. “Approve a 20% content budget increase to sustain the pipeline trajectory” is a decision. “Rankings improved” is a status update. Reports that end with a clear approve-or-reject recommendation retain budgets at a measurably higher rate than those that do not.
Which SEO KPIs actually belong in your report?
Not every metric you can pull from GA4 or Search Console deserves a spot in a KPI report. The table below groups the metrics that do into five purpose-driven categories, with a note on when each becomes a priority.
| KPI Category | KPI Name | Business Question It Answers | Priority By Model |
|---|---|---|---|
| Revenue & Conversion | Organic revenue | Is SEO generating direct income? | E-commerce (primary) |
| Revenue & Conversion | Organic conversion rate | Are organic visitors converting? | All models |
| Revenue & Conversion | Organic-attributed pipeline | How much pipeline did SEO source? | B2B SaaS (primary) |
| Growth & Visibility | Search visibility / SOV | Are we gaining or losing share? | All models |
| Growth & Visibility | Non-branded traffic | Are we reaching new audiences? | All models |
| Growth & Visibility | Keywords in top 10 | How many terms drive real clicks? | Content-heavy sites |
| Engagement & Quality | Conversion rate by landing page | Which pages convert best? | All models |
| Engagement & Quality | Engaged sessions / bounce rate | Is content matching intent? | Media, SaaS, local |
| Technical Health | Core Web Vitals pass rate | Is the site technically sound? | All models |
| Technical Health | Crawl errors / indexation rate | Can Google access our pages? | Large sites |
| AI Search | AI citations (ChatGPT, Claude, Perplexity) | Are we visible in AI answers? | All models, 2026+ |
| AI Search | AI referral traffic | Is AI search sending visitors? | All models, 2026+ |
AI search metrics are no longer optional. Tracking AI citations and tagging AI referral traffic in GA4 via UTM parameters is now a standard component of any forward-looking SEO reporting program. Serpview’s AI Citation Scanner makes it straightforward to monitor which AI platforms are citing your content and how that citation share shifts over time.
Vanity metrics to drop from headline reporting:
- Total impressions (high impressions with low CTR signals poor relevance, not reach)
- Raw keyword count (quantity without rank distribution is meaningless)
- Total backlinks from noisy sources (domain authority proxies without traffic or conversion correlation)
Replace total impressions with CTR by query cluster. Replace raw keyword count with keywords in top 10. Replace total backlinks with a curated set of referring domains that actually drive referral sessions. The AI SEO metrics landscape reinforces this discipline: measure what moves, not what accumulates.
KPI vs. metric: what is the real difference?
A metric is any measurable value. A KPI is a metric that is tied to a business outcome, measured consistently, and triggers a decision when it moves. The distinction sounds academic until you are defending a budget in a quarterly business review.
| KPI | Metric |
|---|---|
| Organic revenue | Total impressions |
| Organic-attributed pipeline | Total sessions |
| Organic conversion rate | Average position |
| Non-branded search visibility | Total backlinks |
| Cost per organic lead | Total keywords tracked |
| AI citation share | AI referral sessions (pre-attribution) |
Rankings are a useful example of the boundary. For your SEO team, average position is a diagnostic metric — it explains why traffic moved. For a CFO, it is not a KPI because it does not answer “did we make money?” A ranking improvement that produces no additional revenue is a metric event, not a KPI event.
HubSpot’s guidance on this is direct: treat a metric as a KPI only when it is actionable, measured consistently, and directly linked to a business goal. Use this four-question checklist before promoting any metric to KPI status:
- Actionable: Does a change in this number trigger a specific decision or action?
- Measurable: Can you pull this number consistently from the same source every reporting period?
- Stakeholder-relevant: Does the audience receiving this report care about what it measures?
- Attribution-traceable: Can you connect this number to organic search activity with reasonable confidence?
If a metric fails any of these four, it belongs in the appendix, not the headline section.
How do you choose KPIs that align with business goals?
Start from the business objective, not the data you have available. HubSpot makes the point clearly: dashboards built around available data rather than business goals produce metrics that do not drive decisions. The mapping process below prevents that.
- Name the business objective. Revenue growth, lead volume, foot traffic, or customer retention. Be specific: “increase qualified pipeline by 25% in the next two quarters.”
- Identify the north-star metric. Per Amplitude’s guidance, the north star must be consistently measurable, move in response to your work, and tie directly to revenue or a revenue proxy. For a B2B SaaS company, organic-attributed pipeline fits all three criteria.
- Map several supporting KPIs that show the causal chain from SEO activity to the north star. Non-branded traffic feeds pipeline. Conversion rate by landing page determines how much of that traffic converts. Core Web Vitals pass rate protects the conversion environment.
- Assign a data source to each KPI. GSC for visibility and click data, GA4 for sessions and conversions, CRM for pipeline and closed revenue, Serpview for consolidated historical tracking and multi-property views.
- Set a SMART target for each KPI. “Increase organic-attributed pipeline by 20% in 90 days, measured via CRM tagging of organic-source leads, baseline set from the prior 90-day period.”
- Calculate cost-to-impact. Compare your organic cost-per-lead against paid CAC. Search Engine Journal recommends pulling pipeline from your CRM and presenting organic CAC versus paid CAC side by side in budget conversations. A CFO who sees organic CAC running 30% below paid CAC has a clear reason to protect the SEO budget. You can find benchmarking guidance for setting those baselines in Serpview’s SEO performance benchmarks resource.
- Get stakeholder sign-off before the first report. Agreed KPIs and targets prevent the “why didn’t you track X?” conversation three months in.
- Schedule a quarterly review to assess whether the KPI set still maps to the current business objective. Objectives shift; your KPI list should shift with them.
How should you customize reports for different audiences?
The three-tier model is the most practical framework for audience-based reporting. The underlying data is the same; the depth, format, and cadence change by tier.
| Tier | Audience | Cadence | Focus | KPI Count |
|---|---|---|---|---|
| Tier 1 | C-suite / board | Quarterly | Revenue impact, ROI, LTV:CAC | 2–3 |
| Tier 2 | Marketing leadership | Monthly | Growth, conversions, search visibility | 4–6 |
| Tier 3 | SEO / dev team | Weekly | Operational health, crawl, Core Web Vitals | 5–9 |
A tiered reporting framework keeps the total KPI count between 5 and 9 across all tiers, which preserves signal clarity. More than nine KPIs in a single report dilutes attention and makes it harder for any stakeholder to know what to act on.
Tier 1 (C-suite, quarterly): One executive slide. North-star metric, variance from target, organic CAC vs. paid CAC, and one recommended action. No rankings. No crawl data. The only question this slide answers is: “Is SEO contributing to revenue?”
Tier 2 (Marketing leadership, monthly): A three-to-five page report or a live dashboard. Organic sessions by channel, conversion rate by landing page, search visibility trend, and non-branded traffic growth. Flag any anomalies with a one-line cause-and-fix note. This audience needs to understand what is driving or suppressing growth.

Tier 3 (SEO/dev, weekly): A shared live dashboard. Core Web Vitals pass rates, crawl errors, indexation ratio, content publishing status, and keyword movement in the top 10. This is the operational layer where problems get caught before they reach the monthly report.
Pro Tip: Assign a named owner to each KPI before the first report goes out. “Marketing owns conversion rate by landing page; dev owns Core Web Vitals pass rate; SEO owns non-branded visibility.” Unowned KPIs drift. Named owners create accountability and speed up escalation when a metric moves in the wrong direction.
Real-time search data is particularly valuable at Tier 3, where weekly cadence means a crawl error or indexation drop needs to surface within days, not at the next monthly review.
How do you measure SEO KPIs accurately across data sources?
Accurate measurement depends on knowing what each tool is authoritative for and reconciling differences before they reach a report.
Primary data sources:
- Google Search Console: Query-level impressions, clicks, CTR, and average position. The authoritative source for organic visibility data. Use GSC for non-branded query segmentation and landing page performance.
- GA4: Sessions, engaged sessions, conversions, revenue, and event-level attribution. The authoritative source for on-site behavior and business outcomes. Configure GA4 events for form submissions, demo requests, phone clicks, and purchase completions before your first report.
- CRM (HubSpot, Salesforce, or equivalent): Pipeline value and closed revenue attributed to organic. Tag every inbound lead with a UTM source at the form level so organic leads are identifiable in the CRM without manual reconciliation.
- Serpview: Consolidated multi-property dashboards, historical tracking beyond GSC’s standard window, and up to 50,000 rows of query data. Use Serpview where GSC’s row limits cut off the long tail of your keyword data.
Reconciliation checklist when numbers differ:
- GSC clicks and GA4 organic sessions rarely match exactly. GSC counts clicks on the search result; GA4 counts sessions that fire a pageview. Bot filtering, JavaScript errors, and redirect chains all cause gaps. Accept a 10–15% variance as normal; investigate anything beyond that.
- If CRM pipeline numbers do not match GA4 conversion counts, check UTM parameter persistence across redirects and form handlers.
- When Serpview data differs from raw GSC exports, confirm that the property and date range filters match exactly.
Attribution guidance. A simple, well-explained estimate beats an overengineered model that no one trusts. Offer both a first-touch and a last-touch organic attribution figure, then note that the true contribution likely sits between the two. Search Engine Land makes this point directly: a reasonable estimate tied to revenue is more useful to stakeholders than a complex model they cannot interrogate. For organic search ROI, the formula is straightforward: subtract SEO spend from organic revenue, divide by SEO spend, and multiply by 100.
AI referral traffic measurement. Tag AI-sourced traffic with UTM parameters at the source level where possible (utm_source=chatgpt, utm_source=perplexity, utm_source=claude). In GA4, create a custom channel grouping for AI referrals so they appear as a distinct traffic segment rather than collapsing into “referral.” Use Serpview’s AI Citation Scanner to track which AI platforms are citing your pages and correlate citation volume with referral session spikes.
How do you put KPI-driven reporting into practice?
The gap between understanding KPI-driven reporting and actually running it closes with a concrete onboarding checklist and reusable templates. The sequence below applies whether you are onboarding a new client or rebuilding an internal reporting program.
KPI-selection worksheet (template structure):
| Step | Question | Your Answer |
|---|---|---|
| 1. Business outcome | What does the business need SEO to deliver? | e.g., 200 qualified leads per quarter |
| 2. North-star metric | Which single metric best measures that outcome? | e.g., organic-attributed pipeline |
| 3. Supporting KPIs | Which 4–8 metrics explain north-star movement? | e.g., non-branded traffic, conversion rate by LP |
| 4. Data sources | Where does each KPI come from? | GSC, GA4, CRM, Serpview |
| 5. Targets | What is the SMART target for each KPI? | e.g., +20% pipeline in 90 days |
| 6. Owner | Who is accountable for each KPI? | Named individual or team |
Step-by-step onboarding checklist:
- Identify the business outcome and get stakeholder sign-off on the north-star metric.
- Configure GA4 events for every conversion action: form submissions, demo bookings, phone clicks, and purchases.
- Set up CRM tagging so organic-source leads carry a consistent UTM parameter through to closed revenue.
- Connect GSC and Serpview to your reporting environment. In Serpview, configure multi-property consolidation and set the historical baseline window to at least 90 days.
- Build the executive dashboard first. Define KPIs, then design the dashboard around them — not the other way around, as HubSpot advises.
- Share the Tier 1 and Tier 2 dashboards with stakeholders via Serpview’s shared dashboard feature so they can access live data between formal reporting cycles.
- Run the first report at the end of week four. Flag baselines, not performance, since 30 days is too short to show trend.
Serpview in the onboarding workflow. Serpview’s value shows up most clearly at steps 4 and 6. GSC caps query exports at 1,000 rows, which means the long tail of your keyword data — often where conversion-intent queries live — is invisible in native GSC reporting. Serpview surfaces up to 50,000 rows, giving you a complete picture of which queries are driving clicks and where conversion opportunities are being missed. The shared dashboard feature lets you push live KPI data to clients or internal stakeholders without requiring them to log in to multiple platforms.
Handling AI search metrics in your tooling. Add an “AI Search” section to your Tier 2 monthly report. Populate it with AI citation count (from Serpview’s AI Citation Scanner), AI referral sessions (from GA4’s AI channel grouping), and AI share of voice relative to competitors. Use custom annotations in Serpview to mark dates when major AI platform updates occur, so you can correlate citation shifts with platform changes rather than attributing them to your own content changes.
Pro Tip: Pre-built templates with 12 months of tracking history make reports repeatable and far easier to defend in budget reviews. Build your KPI template once, lock the structure, and update only the data each period. Changing the template mid-engagement makes trend comparisons unreliable and raises questions you do not want to answer in a renewal meeting.
Key Takeaways
KPI-driven SEO reporting works when you select one north-star metric, map 4–8 supporting KPIs to business outcomes, and deliver audience-tiered reports at consistent cadences — never more than nine KPIs total across all tiers.
| Point | Details |
|---|---|
| North-star first | Every report cover must open with one metric that ties directly to revenue or a revenue proxy. |
| Five to nine KPIs total | Keeping the total KPI count to a modest number across all tiers preserves signal clarity and prevents stakeholder confusion. |
| Three-tier cadence | C-suite quarterly on revenue, marketing monthly on growth, SEO/dev weekly on operational health. |
| End with a recommendation | Reports that close with a single approve-or-reject action retain budgets more effectively than status updates. |
| Serpview for scale | Serpview extends GSC’s 1,000-row limit to 50,000 rows and hosts shared live dashboards, making tiered reporting operationally sustainable. |
The reporting mistakes that actually cost you budgets
Most SEO reporting failures come down to three patterns, and all three are avoidable.
The first is the data dump. A report that lists every metric available from GA4 and GSC is not a report; it is a spreadsheet export with a cover page. Stakeholders read the first slide, skip the rest, and conclude that SEO is a black box. The fix is selection: choose the metrics that answer the business question, and leave everything else in the appendix or out entirely.
The second is vanity-metric reporting. Rankings and impressions look like progress when the business is flat. A client who sees “average position improved from 14 to 11” and then checks their revenue dashboard and sees no change will eventually question whether SEO is working at all. Reframing that same period’s report around organic-attributed pipeline — even if the pipeline number is modest — gives the work a commercial context that rankings cannot provide. The ThatDevPro reporting framework captures this well: selection, narrative, and action are the three disciplines that determine whether a report defends a budget or loses it.
The third is overengineered attribution. Multi-touch attribution models that require a data engineer to explain are not useful in a quarterly business review. A first-touch and last-touch estimate, presented side by side with a plain-language note that the true contribution sits between them, is more credible than a model no one can interrogate. Stakeholders trust transparency over precision.
One pattern worth noting: engagements that pivot from ranking-focused reports to revenue-focused reports mid-contract often see an immediate improvement in stakeholder confidence, even before the underlying numbers change. The report is the visible artifact of the engagement. As ThatDevPro observes, a well-executed engagement with poor reporting can churn, while a mediocre execution with great reporting can retain. That asymmetry is uncomfortable but accurate.
In week one after onboarding, focus on baselines: confirm that GA4 events are firing correctly, that CRM tagging is consistent, and that Serpview is pulling the full query dataset. Do not report performance yet. A baseline set on bad data will haunt every subsequent report.
Serpview makes KPI-driven reporting sustainable at scale
Building a tiered KPI reporting program from scratch is straightforward when you have the right infrastructure. Serpview is built specifically for the reporting workflow this guide describes: consolidated multi-property dashboards, query data up to 50,000 rows (versus GSC’s 1,000-row cap), historical performance tracking, and a shared dashboard feature that puts live KPI data in front of stakeholders without requiring them to log in to multiple tools.

The practical setup takes four steps. Connect your GSC properties and GA4 account to Serpview, import CRM conversion data, select your north-star metric in the KPI-selection worksheet, and share the executive dashboard with stakeholders via Serpview’s shared dashboard. For AI search tracking, the AI Citation Scanner monitors which AI platforms are citing your content and feeds that data directly into your Tier 2 monthly report. Use custom annotations to mark algorithm updates, site launches, and content pushes so KPI shifts always have context.
Ready to move from status-update reports to budget-defending KPI dashboards? Start a Serpview trial at serpview.com and connect your first GSC property in under ten minutes.
Useful sources
| Source | What It Covers |
|---|---|
| Search Engine Land — Reporting SEO results executives care about | Revenue-first reporting framing and attribution guidance for executive audiences |
| Search Engine Journal — SEO KPIs for the C-suite | Mapping organic CAC, pipeline, and ROI to budget conversations |
| HubSpot — KPI in SEO: The metrics that actually matter | KPI vs. metric distinction and dashboard design principles |
| Amplitude — North-star metric guidance | Selection criteria for defining and validating a north-star metric |
| CrawlRaven — SEO KPI report: 20 metrics to track in 2026 | AI search metrics, tracking conventions, and downloadable KPI templates |
| ThatDevPro — SEO reporting framework | Selection, narrative, and action as the three pillars of defensible reporting |
| Digital Strategy Force — Tiered KPI reporting | Three-tier cadence model and the 5–9 KPI rule |
| Serpview — AI Citation Scanner | Tool for tracking AI platform citations and AI referral traffic |
| Serpview — Shared Dashboard | Live KPI sharing for multi-stakeholder reporting environments |
| BabyLoveGrowth — AI SEO metrics for 2026 | AI-specific SEO metrics and measurement patterns for current AI search surfaces |
FAQ
What is a KPI for SEO?
A KPI for SEO is a metric tied directly to a business outcome — such as organic revenue, organic-attributed pipeline, or cost per organic lead — that is measured consistently and triggers a decision when it moves. Metrics like total impressions or average position are useful diagnostics but are not KPIs unless they connect to a commercial result.
What is KPI-driven reporting?
KPI-driven reporting is a discipline that selects a small set of metrics aligned to business goals, assigns a north-star metric to anchor every report, and delivers findings at audience-appropriate cadences — quarterly for executives, monthly for marketing leadership, and weekly for SEO and dev teams.
What are the four types of SEO?
The four types of SEO are on-page SEO (content and keyword optimization), off-page SEO (backlinks and authority signals), technical SEO (crawlability, indexation, and Core Web Vitals), and local SEO (geographic relevance and Google Business Profile optimization). KPI-driven reporting tracks outcomes across all four types rather than treating them as separate programs.
How many KPIs should an SEO report include?
A well-structured SEO reporting program tracks between 5 and 9 KPIs total across all audience tiers, with 2–3 reserved for the executive layer and the remainder distributed across marketing and operational dashboards. More than nine KPIs dilutes the signal and makes it harder for any stakeholder to know what to act on.
How does Serpview support KPI-driven SEO reporting?
Serpview consolidates data from multiple GSC properties into a single dashboard, surfaces up to 50,000 rows of query data (versus GSC’s 1,000-row cap), and provides shared live dashboards so stakeholders can monitor KPIs between formal reporting cycles. Its AI Citation Scanner also tracks which AI platforms are citing your content, covering the AI search layer that standard GSC reporting does not capture.
Recommended
Ready to unlock your full GSC potential?
SERPView helps you access all your Google Search Console data without limitations. Start your free trial today.
Get Started Free