
Segment Organic Traffic by Device Type: SEO Guide
SERPView Team
SEO Analytics

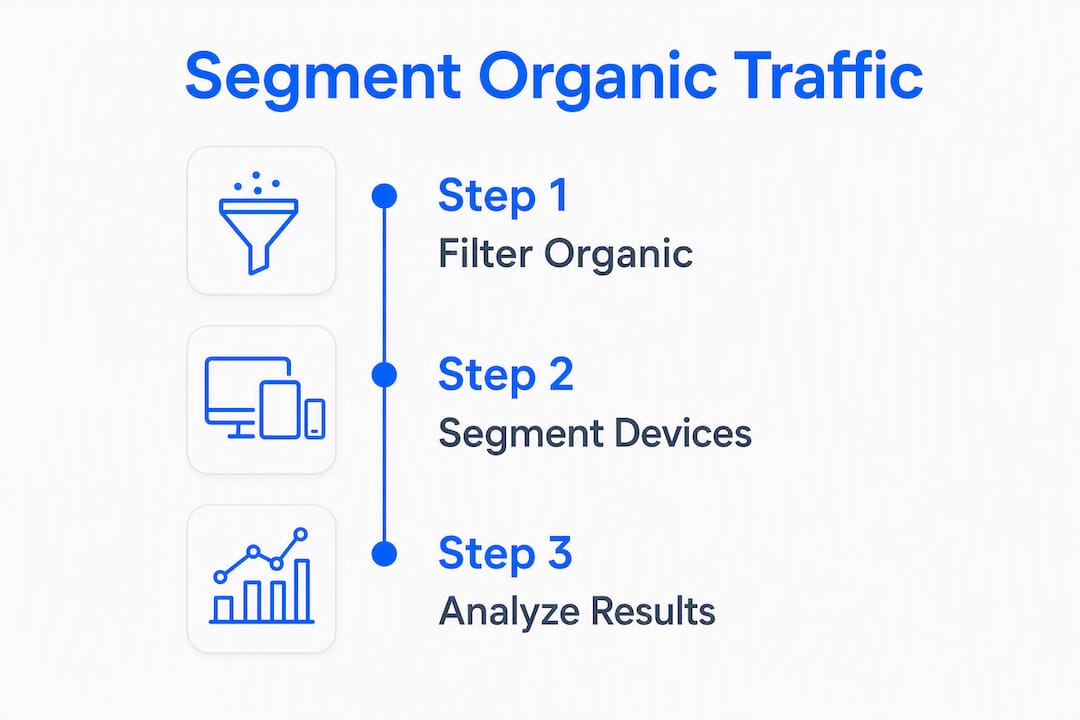
To segment organic traffic by device type, open GA4, isolate your Organic Search channel, then apply the Device category dimension — desktop, mobile, or tablet — as a breakdown in either the Traffic Acquisition report or a custom Exploration. That two-step move gives you the device-split data you need to diagnose conversion gaps, prioritize fixes, and report to stakeholders.
Here is what to do in the next 10 minutes:
- Open GA4 Traffic Acquisition. Filter by “Organic Search” using the Session primary channel group, then add Device category as a secondary dimension.
- Build or open an Exploration. Create a free-form Exploration with an Organic Search segment, Device category as a row dimension, and your core metrics as columns.
- Check your top five landing pages by device. Look for pages where mobile sessions are high but conversions are low — that gap is your first priority.
- Open Google Search Console in a second tab. Pull the Search results report, filter by device, and compare clicks per landing page against what GA4 shows for sessions.
Two tools, one workflow. Everything below shows you exactly how to run it.
Table of Contents
- How to segment organic traffic by device in GA4 Traffic Acquisition
- How to build a reusable “Organic by device” Exploration in GA4
- How to find landing pages with device-specific performance drops
- Which metrics to compare by device and what each difference usually means
- What causes device performance gaps and how to diagnose them fast
- When to use Google Search Console vs. GA4 for device insights
- What to do when desktop, mobile, and tablet labels are not enough
- How Serpview helps with device-based organic analysis across properties
- Key Takeaways
- What analysts actually get wrong when diagnosing device gaps
- Serpview gives you device-segmented organic data across every property you manage
- Useful sources and documentation
- FAQ
How to segment organic traffic by device in GA4 Traffic Acquisition
The Traffic Acquisition report is the fastest path to a device split without building anything custom. It takes about three minutes and works well for quick triage or a stakeholder check-in.
- In GA4, go to Reports > Acquisition > Traffic acquisition.
- In the “Session primary channel group” column, locate Organic Search — or use the search bar above the table to filter the report to that channel.
- Click the “+” icon next to the primary dimension and select Device category as a secondary dimension. GA4 will now break each channel row into desktop, mobile, and tablet sub-rows.
- Glance at four metrics for a rapid triage: sessions, engaged sessions, conversions, and engagement rate. A large session share on mobile with a low engagement rate is a signal worth investigating.
- To validate the segment is truly organic, add Session source/medium as a secondary dimension instead of Device category and confirm the rows show
google / organic,bing / organic, or similar. Switch back to Device category once confirmed.
Quick validation tip: If you see (direct) / (none) contributing a surprising share of sessions, check whether your UTM tagging is consistent. Misattributed direct traffic can inflate or deflate organic device counts.
Pro Tip: Add a date comparison (previous period or same period last year) before you screenshot the report. A device-level drop that looks alarming in isolation often turns out to be seasonal when you see the year-over-year line.
How to build a reusable “Organic by device” Exploration in GA4
The Traffic Acquisition report is useful for a quick look, but a saved Exploration gives you a repeatable template you can share across properties and export on demand. These steps align with the standard walkthrough used by most GA4 practitioners.
- In GA4, go to Explore and click “Blank” to start a free-form Exploration.
- Name it something like
Organic Search by Device — [Property Name]. - In the Variables panel, click “+” next to Dimensions and import: Device category, Landing page + query string, and First user source / medium.
- Click “+” next to Metrics and add: Sessions, Engaged sessions, Conversions, Conversion rate, Average engagement time, and Revenue (if applicable).
- In the Settings panel, drag Device category into the Rows slot. Drag Landing page + query string into Rows below it to create a nested breakdown.
- Drag your chosen metrics into the Values slot.
- Click “+” next to Segments and create a new Session segment. Set the condition:
Session source / medium contains "organic"— or use the pre-built Organic Search segment if it appears in your segment library. - Apply the segment to the Exploration. Your table now shows organic sessions broken down by device, then by landing page.
- To save as a template, click the share icon (top right) and copy the link. Anyone with GA4 access to the property can open it. To use it across properties, duplicate the Exploration inside each property and re-apply the segment.
- To export, click the three-dot menu and select Export data as CSV.
Session scope vs. user scope: which one to use
Session scope answers “what happened during visits that came from organic search on each device?” User scope answers “which devices do my organic visitors use across multiple sessions?” For landing-page diagnostics, session scope is almost always the right choice. User scope is more useful when you want to understand cross-device journeys — for example, whether users who first arrive on mobile tend to convert on desktop later.

Pro Tip: Add Landing page + query string as a second row dimension alongside Device category. This surfaces pages where mobile and desktop conversion rates diverge sharply, which is exactly the list your dev team needs.
How to find landing pages with device-specific performance drops
Once your Exploration is running, the next step is turning the data into a prioritized list of pages to fix. Exporting a landing-page-by-device table and computing deltas is the standard approach practitioners use to build dev tickets.
Here is the workflow:
- Run the nested table. In your Exploration, set rows to Landing page + query string, then Device category. Set columns to Sessions, Conversions, and Conversion rate.
- Compute the delta. For each landing page, subtract the mobile conversion rate from the desktop conversion rate. A gap of more than a few percentage points on a high-traffic page is worth acting on.
- Apply the volume × delta rule. Prioritize pages where organic sessions are high and the conversion gap is large. A page with 5,000 monthly organic sessions and a 4% mobile-vs-desktop conversion gap outranks a page with 200 sessions and a 10% gap in terms of revenue impact.
- Export the CSV. Click the three-dot menu in the Exploration and export. Open in Google Sheets or Excel, sort by the delta column descending, and filter to pages above your session threshold.
- Build the dev ticket. Include: landing page URL, device category, sessions, conversions, conversion rate, average engagement time, and the date range. A short sample dataset in the ticket removes ambiguity for engineers.
Pro Tip: Set a rolling 90-day window rather than a 30-day window when you export. Thirty days can include a bad week that skews the delta. Ninety days gives you a more stable baseline, especially for pages with moderate traffic.
Which metrics to compare by device and what each difference usually means
Not every metric gap points to the same problem. The table below maps each metric to what a negative delta on mobile typically indicates and the first test to run.
| Metric | What a mobile deficit usually signals | First test to run |
|---|---|---|
| Sessions / users | Crawl or indexing issue on mobile; or lower mobile SERP visibility | Check Search Console mobile impressions and clicks |
| Engaged sessions / engagement rate | Content loads slowly or layout breaks on small screens | Run Lighthouse on mobile; check CLS and LCP |
| Average engagement time | Users leave quickly — content may not match mobile intent | Review above-the-fold content on a real device |
| Conversion rate | Form friction, CTA placement, or tracking not firing on mobile | Test the conversion flow on a real device; check GA4 DebugView |
| Revenue | Compound effect of conversion rate and average order value gaps | Segment by product or page type to isolate the source |
| Bounce / exit rate | Landing page experience mismatch for mobile visitors | Compare mobile vs desktop page layout and load time |
A few additional points worth keeping in mind:
- Check sample size before acting. A 2% conversion gap on 50 mobile sessions is noise. The same gap on 2,000 sessions is a signal. Use rolling windows of at least 30 days, and prefer 90 days for lower-traffic pages.
- High mobile sessions with low mobile conversions is the most common pattern. It usually points to UX or speed problems, not a traffic quality issue.
- Revenue gaps can be misleading if your product mix differs by device. Segment by product category or page type before drawing conclusions.
- Engagement time differences sometimes reflect content format rather than a problem. Long-form articles often show lower mobile engagement time simply because users read faster on mobile or switch devices mid-session.
What causes device performance gaps and how to diagnose them fast
When one device underperforms, the cause is almost always in one of three buckets: technical, UX, or measurement. Work through them in that order.
Technical causes:
- Slow mobile page speed, high Cumulative Layout Shift (CLS), or poor Largest Contentful Paint (LCP) — check with PageSpeed Insights or Lighthouse in Chrome DevTools
- Lazy-load issues that prevent key content or images from rendering above the fold on mobile
- Responsive design breakpoints that break layouts on specific screen sizes
- Bot or crawler traffic inflating desktop session counts and skewing comparisons
- Consent management prompts blocking conversion events on mobile browsers
UX causes:
- Mobile navigation that buries the CTA below the fold
- Forms with too many fields or inputs that are hard to use on a touchscreen
- Intrusive interstitials on mobile (which Google also penalizes in rankings)
- CTA buttons too small or too close together for touch targets
Quick tests to run:
- Lighthouse (in Chrome DevTools or via PageSpeed Insights) for mobile performance scores and Core Web Vitals
- Chrome DevTools mobile emulation to check layout at common screen sizes
- GA4 DebugView to confirm conversion events fire correctly on mobile — this is the most commonly skipped step
- Search Console mobile usability report for crawl-level mobile issues
- Real-device testing on at least one mid-range Android and one iPhone, since emulators miss some rendering issues
Pro Tip: Before blaming UX, confirm the conversion event actually fires on the device. Open GA4 DebugView on your phone, complete the conversion action, and watch for the event in real time. A missing event means a measurement problem, not a UX problem — and those require completely different fixes.
When to use Google Search Console vs. GA4 for device insights
GA4 and Google Search Console measure different things, and the numbers will not match. Understanding why helps you use each tool correctly rather than chasing a discrepancy that does not exist.
- GSC counts clicks from Google Search results pages. GA4 counts sessions on your site. A user can click twice and generate one session, or click once and generate zero sessions if the page fails to load.
- GSC is the right tool when you want to know how many people clicked your result on mobile vs. desktop, what your CTR looks like by device, or whether impressions are growing on one device but not another.
- GA4 is the right tool when you want to know what those visitors did after they arrived — engagement, conversions, revenue, time on page.
- How to drill into landing pages by device in GSC: Go to Search results > filter by device > click the Pages tab. You can now see clicks, impressions, CTR, and average position per landing page for each device type. The Google organic search traffic report in GA4 also surfaces Search Console metrics alongside GA4 metrics in one view, which is useful for a combined check.
- Privacy-first analytics tools like Plausible parse the User-Agent HTTP header to split traffic by desktop, mobile, and tablet while discarding the full header data. If you run Plausible alongside GA4, its device split can serve as a corroborating data point when you suspect GA4 consent-mode gaps are distorting your mobile numbers.
Practical workflow: Spot a mobile conversion gap in GA4 → verify that mobile clicks and impressions in GSC are healthy (ruling out a ranking problem) → run Lighthouse and DebugView on a mobile device to isolate whether the issue is speed, UX, or tracking.
For a deeper look at how GSC device reporting works and when to rely on it, the Serpview GSC glossary entry covers the key distinctions.
What to do when desktop, mobile, and tablet labels are not enough
For most sites, the three standard device categories give you enough to act on. For high-performance sites, they can hide meaningful differences. A flagship smartphone and a three-year-old mid-range Android both register as “mobile,” but their rendering capabilities, connection speeds, and screen sizes differ substantially.

Device intelligence services enrich User-Agent headers to produce granular metadata: screen size, hardware capability, device model, and operating system version. That level of detail enables targeted content delivery — for example, serving lighter image assets to lower-end devices or adjusting layout breakpoints based on actual screen dimensions rather than assumed categories.
GA4’s Tech overview report separates platform (Android, iOS, Web) from device category, which is a useful first step beyond the basic three-way split. You can combine platform and device category dimensions in an Exploration to see, for instance, whether iOS mobile users convert differently from Android mobile users.
Practical limits to keep in mind:
- Cross-device users are counted separately in GA4 unless they are logged in and you have User-ID enabled. A user who browses on mobile and converts on desktop appears as two separate sessions.
- App vs. web differences mean that if you have a native app, app sessions do not appear in your web GA4 property by default. You need a separate app data stream or a combined app+web property.
- IoT and smart-TV traffic registers inconsistently across analytics platforms. GA4 may classify a smart TV as “desktop” or leave it uncategorized. For most sites this is a negligible edge case, but for streaming or media properties it can distort device comparisons.
- Privacy constraints are tightening User-Agent availability. Modern browsers send reduced User-Agent strings, which limits what device intelligence services can infer without additional signals.
Advanced classification adds real value for teams running personalization at scale or managing high-traffic e-commerce sites. For most SEO diagnostic workflows, the standard GA4 device categories combined with platform data are sufficient.
How Serpview helps with device-based organic analysis across properties
GA4 and Search Console each have a hard ceiling on how much data you can see at once. Search Console’s standard interface caps exports at 1,000 rows, which means a large site or an agency managing multiple clients will routinely miss the long tail of landing pages where device gaps are hiding.
Serpview removes that ceiling. It consolidates Search Console data across multiple properties into a single dashboard and supports exports of up to 50,000 rows, so you can pull a complete landing-page-by-device table without truncating results. Pre-built device and country segmentation reports are available out of the box, and shareable dashboards let you send a live view to clients or stakeholders without granting full Search Console access.
For an agency managing 30 client properties, the practical workflow looks like this: connect all properties to Serpview, run the device segmentation report across all sites simultaneously, export the full dataset, and sort by the volume × delta heuristic to surface the highest-impact landing pages across the entire portfolio. That process, which would take hours of manual GSC exports and spreadsheet merging, runs in minutes.
Serpview also overlays custom annotations on performance charts, so you can mark the date of a site redesign or a Core Web Vitals fix and see whether mobile metrics improved afterward. That longitudinal context is what separates a one-time audit from an ongoing monitoring workflow.
For teams focused specifically on mobile search performance, the Serpview mobile tracking guide covers device-specific diagnostics in more depth.
Key Takeaways
Segmenting organic traffic by device type in GA4 requires two steps: isolate the Organic Search channel, then apply Device category as a breakdown dimension to compare sessions, conversions, and engagement across desktop, mobile, and tablet.
| Point | Details |
|---|---|
| Start in Traffic Acquisition | Filter to Organic Search and add Device category as a secondary dimension for a fast triage in under three minutes. |
| Build a reusable Exploration | Create a session-scoped Exploration with Landing page + query string and Device category as row dimensions, then export as CSV for dev tickets. |
| Prioritize by volume × delta | Focus on pages with high organic sessions and a large mobile-vs-desktop conversion rate gap — those have the greatest revenue impact. |
| Cross-check with Search Console | Use GSC for click and impression data by device; use GA4 for on-site engagement and conversions — the two tools measure different things. |
| Serpview for cross-property scale | Serpview exports up to 50,000 rows of device-segmented Search Console data across multiple properties, removing the standard 1,000-row cap. |
What analysts actually get wrong when diagnosing device gaps
The standard advice on device segmentation is technically correct but misses the most common failure mode: analysts act on the data before confirming the data is accurate.
The single most skipped step in any mobile conversion investigation is verifying that the conversion event actually fires on the device. GA4 DebugView takes two minutes to check, yet most analysts go straight to redesigning the mobile CTA or filing a speed ticket. Half the time, the “mobile conversion problem” is a tracking problem — a consent prompt blocking the event, a tag that fires on desktop but not on a mobile browser’s strict mode, or a form submit event that never triggers because the button is outside the form tag on mobile.
The second blind spot is misattributed traffic. If your UTM tagging is inconsistent across campaigns, some paid or social mobile traffic lands in the organic bucket. That inflates mobile sessions without adding mobile conversions, which manufactures a gap that does not reflect organic search behavior at all. Always validate source/medium before drawing conclusions from a device split.
The third issue is stakeholder communication. Executives do not need a device breakdown table. They need one number: the estimated revenue impact of the mobile conversion gap. Take your monthly organic mobile sessions, multiply by the conversion rate delta between desktop and mobile, multiply by average order value, and that is the number to put in the slide. Everything else goes in the engineering ticket.
For the engineering ticket, include the landing page URL, device category, sessions, conversion rate, average engagement time, and a screen recording of the issue on a real device. That package gets tickets prioritized faster than any amount of written description.
Serpview gives you device-segmented organic data across every property you manage
If you are running device analysis across more than two or three properties, the manual GA4 and Search Console workflow gets slow fast. Serpview consolidates Search Console imports across all your properties into one place, with up to 50,000 rows of exportable data per report — no more hitting the 1,000-row ceiling mid-export.

Pre-built device and country segmentation reports mean you do not need to rebuild the same Exploration in every property. Shared dashboards let you send a live, branded view to clients without giving them full account access. And custom annotations let you track exactly when a fix went live so you can measure its impact on mobile performance over time.
Agencies and multi-site teams use Serpview to run the volume × delta prioritization across entire client portfolios in one export. If that workflow fits what you are trying to do, start a trial at serpview.com and connect your first property in under five minutes.
Useful sources and documentation
- GA4 Device category dimension — official documentation on how GA4 populates desktop, mobile, and tablet labels automatically.
- GA4 Tech overview report — explains the platform vs. device category distinction and how to use the Tech overview for deeper device splits.
- Google organic search traffic report in GA4 — shows how to drill into landing pages by device using the pre-built organic search report that surfaces both GSC and GA4 metrics.
- DeviceAtlas device intelligence — covers how device intelligence services enrich User-Agent metadata to produce screen size, hardware capability, and device model data.
- Serpview mobile search performance tracking — device-specific diagnostic examples and reasons to track mobile search separately.
- Serpview search analytics data export guide — step-by-step instructions for exporting search analytics data for use in dev tickets and reporting.
- Mobile-friendly SEO: boost SaaS traffic — practical guidance on mobile optimization and the case for prioritizing mobile fixes.
FAQ
What is an example of organic traffic?
Organic traffic is any visit that arrives from an unpaid search engine result — for example, a user clicking a Google result for “best project management tools” without a paid ad label. In GA4, this traffic appears under the Organic Search channel in the Traffic Acquisition report.
What is the device category dimension in Google Analytics?
The Device category dimension in GA4 classifies each session as desktop, mobile, or tablet based on the User-Agent string sent by the visitor’s browser. It populates automatically and can be used as a secondary dimension or a segment breakdown in both standard reports and Explorations.
Which report helps you understand what kinds of devices visitors used?
The GA4 Tech overview report shows users broken down by platform and device category, covering Android, iOS, and Web alongside desktop, mobile, and tablet. For organic-specific device data, a custom Exploration with an Organic Search segment and Device category as a row dimension gives a more precise view.
How do GA4 session counts differ from Google Search Console click counts by device?
GSC counts clicks on your search result; GA4 counts sessions on your site. A user can click twice and start one session, or a failed page load can produce a click with no session. Use GSC for SERP-level device performance (clicks, impressions, CTR) and GA4 for on-site behavior (engagement, conversions, revenue).
Can you segment organic traffic by device type without building a custom Exploration?
Yes. In the Traffic Acquisition report, filter to Organic Search and add Device category as a secondary dimension for an immediate device split. For a more detailed landing-page breakdown, a saved Exploration gives you a reusable template you can export and share across properties.
Recommended
Ready to unlock your full GSC potential?
SERPView helps you access all your Google Search Console data without limitations. Start your free trial today.
Get Started Free