
SEOs: Turn SEO Benchmarks Into SMART Targets With 50,000 Row Exports
SERPView Team
SEO Analytics

SEO industry benchmarks are the midpoint ranges that show how a site’s organic performance compares to peers by sector and metric. The metrics that matter most are click-through rate, organic traffic growth year over year, organic conversion rate, engagement (bounce rate and session duration), keyword ranking distribution, and Core Web Vitals.
TL;DR:
- Industry benchmarks vary significantly by sector, with content-heavy industries like SaaS showing stronger traffic growth but lower conversion rates.
- Metrics such as click-through rate, organic traffic growth, and ranking distribution are essential, but they must be matched carefully to industry, traffic scale, and business model.
- Benchmarks should be converted into SMART targets based on business outcomes, with proper baselines, timelines, and data quality to ensure meaningful progress tracking.
- A comprehensive benchmarking dashboard integrates data from Search Console, GA4, rank trackers, and backlink tools, with regular monthly and weekly reviews to identify anomalies early.
- Using full-historical data tools like SERPView helps improve benchmarking accuracy, supports advanced filtering, and enhances the ability to demonstrate SEO’s full impact to stakeholders.
Table of Contents
- What Are SEO Industry Benchmarks, and Why Do Midpoints Matter?
- What Do Core SEO Metrics Actually Measure?
- Which Industry Benchmarks Should You Actually Compare Against?
- How Do You Turn Benchmarks Into SMART SEO Targets?
- What Should a Benchmark Monitoring Dashboard Include?
- Practitioner Perspective: What Good Benchmarking Actually Looks Like
- Operationalize Your Benchmarks With SERPView
- Sources
- FAQ
What Are SEO Industry Benchmarks, and Why Do Midpoints Matter?
You already know that a single ranking report tells you almost nothing on its own. Position 8 for one keyword could be a disaster or a win. It depends entirely on what “normal” looks like for your industry, your traffic volume, and your business model. That’s the whole point of a benchmark: it turns an isolated number into a comparison.
Most benchmark reports don’t hand you one precise figure per metric. They give you a range and a midpoint, because performance varies by tool, by sample, and by how a study defines “organic.” The Similarweb 2025 SEO Benchmarking Report makes this explicit: its numbers come from aggregating multiple tool datasets, and it flags methodology differences rather than pretending to deliver forensic precision. Treat every figure below the same way, as a directional marker, not a pass/fail line.
Here’s a compact scan of where several major industries sit on five core metrics. Use it to spot whether your program is roughly on pace, running hot, or lagging before you dig into the diagnostic work in the next section.
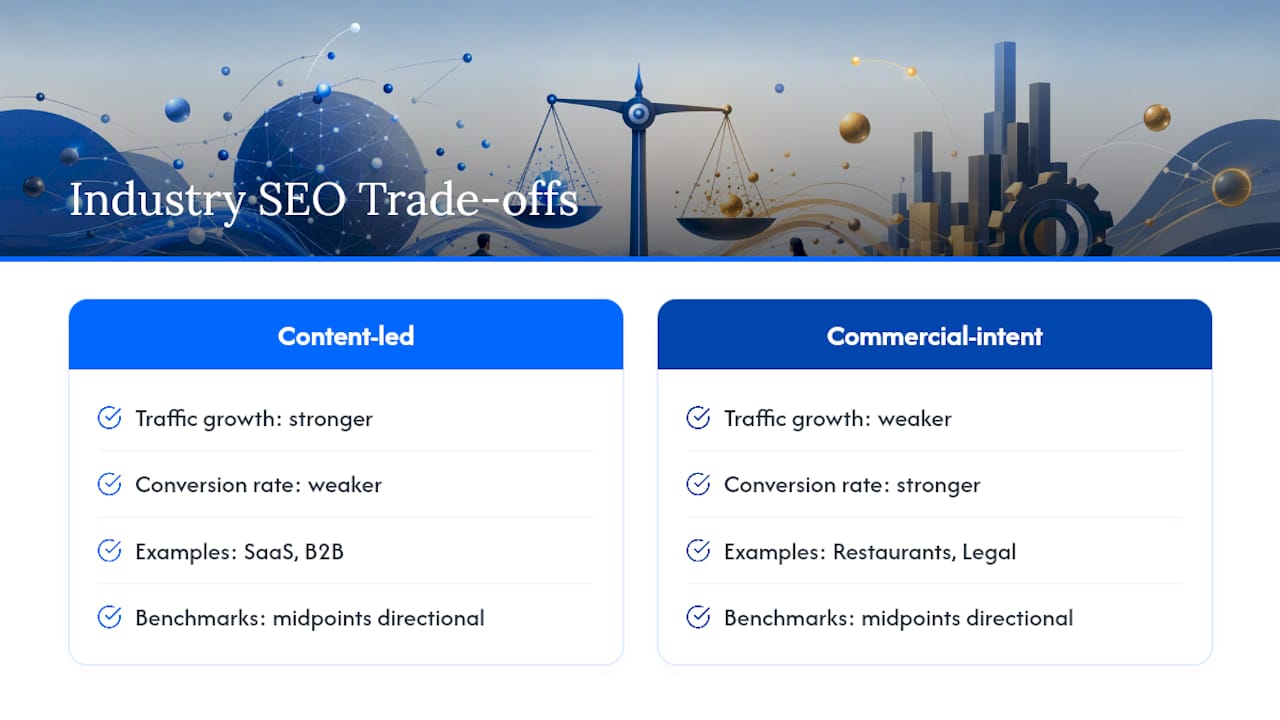
The pattern that jumps out: content-led categories like SaaS and B2B post stronger traffic growth but weaker conversion rates, while high commercial-intent categories like restaurants and legal show the opposite. That split shows up consistently across industry benchmark aggregations, and it’s the single biggest reason a generic “good SEO” number doesn’t exist.
What Do Core SEO Metrics Actually Measure?
Each metric in the table above answers a different question, and mixing them up is how analysts end up chasing the wrong fix. Here’s what each one is actually telling you.
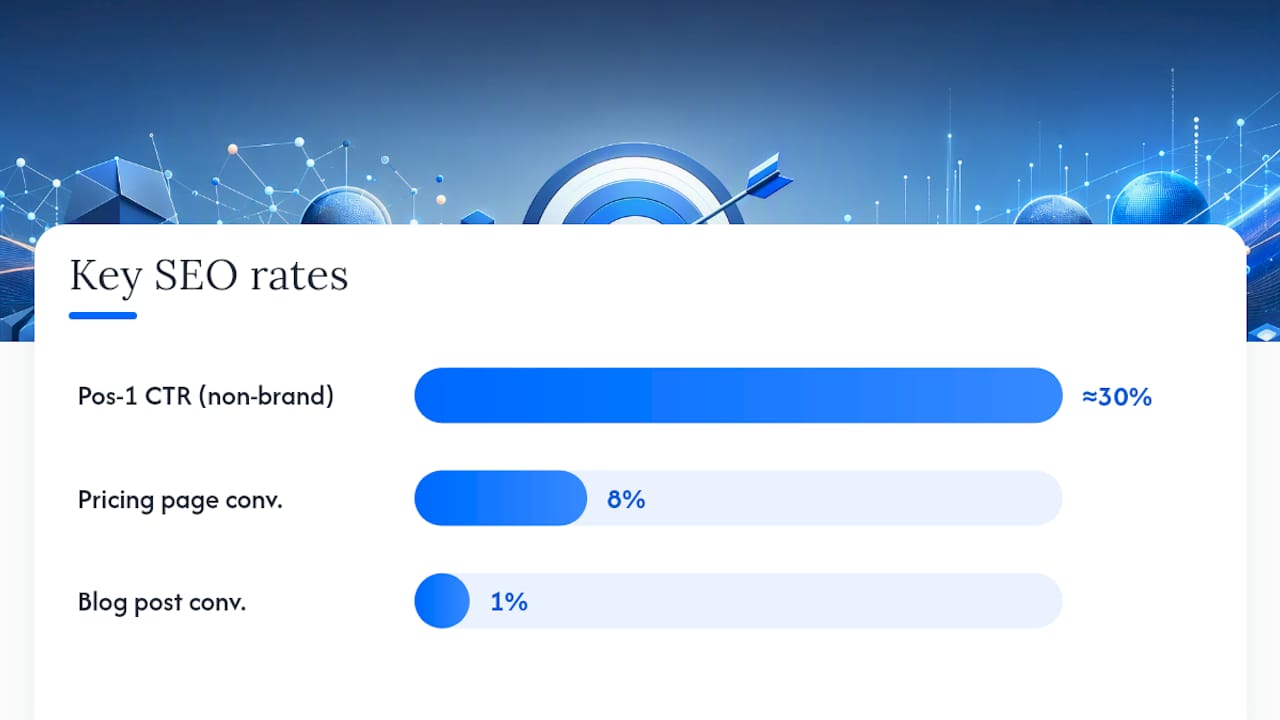
- Click-through rate (CTR) measures how often people click your listing relative to how often they see it. Position matters enormously: position-one listings capture roughly 27% to 32% of clicks for non-branded queries, while SERP features like featured snippets, People Also Ask boxes, and ads can pull that share down even at the top spot.
- Organic traffic growth (YoY) should always be measured year over year, not month over month, because search demand swings with seasonality. Compare the same 28-day window against last year’s equivalent window rather than a raw trailing month.
- Organic conversion rate is the metric that actually ties to revenue, and it needs to be segmented by intent and landing page type. A blog post converting at 1% and a pricing page converting at 8% are both “normal,” but averaging them together tells you nothing useful.
- Engagement metrics (bounce rate, pages per session, average session duration) work best as diagnostic signals, not goals in themselves. A rising bounce rate on a page that used to hold attention often flags a content mismatch or a technical regression worth investigating.
- Ranking distribution matters more than any single keyword position. Track the share of your tracked keywords sitting in positions 1–3, 4–10, and 11–20. A site with 200 keywords in positions 4–10 has a much bigger growth lever than a site with 5 keywords stuck at position 1, because improving CTR on pages ranked 5–10 often produces ranking and traffic gains within a few weeks to months.
Move a page from position 8 to position 3 and you’re not just gaining rank, you’re often multiplying click volume several times over on the same impression count.
Core Web Vitals round out the technical layer. The working thresholds practitioners use are LCP under 2.5 seconds, INP under 200 milliseconds, and CLS under 0.1. Pages that clear all three tend to show lower bounce rates and better engagement, which is why Core Web Vitals belongs in a supporting role behind your business metrics rather than as a headline KPI.
Which Industry Benchmarks Should You Actually Compare Against?
Picking the wrong peer group is the fastest way to make a healthy SEO program look broken, or a struggling one look fine. Before you compare your numbers against any industry midpoint, you need to know why industries differ in the first place.
Three forces drive the spread you saw in the earlier table:
- Intent mix. Restaurant searches skew heavily transactional (“near me,” “reservation”), which is why restaurant conversion rates run 4% to 8% against SaaS’s 1% to 3%.
- Decision latency. Finance and legal buyers research for weeks or months before converting, which suppresses first-visit conversion rates even when demand is strong.
- Query geography. Real estate and restaurants deal heavily in local queries, while B2B and SaaS compete on national or global terms with very different volume ceilings.
Google’s own ranking systems guide is a useful reminder here too: rankings come from multiple systems evaluating content quality and site-level signals together, and third-party domain metrics are proxies, not direct measurements of those systems. That’s one more reason to treat industry midpoints as scaffolding rather than a scorecard.
When you’re choosing who to benchmark against, apply three filters:
- Match business model first. A subscription SaaS company shouldn’t benchmark against a one-time-purchase eCommerce store, even if both sell software.
- Match traffic scale second. A site pulling 5,000 monthly organic sessions won’t behave like one pulling 500,000, regardless of shared industry label.
- Match topical focus third. Topical authority increasingly separates comparable sites within the same industry, so a broad content publisher and a narrow niche authority site in the same vertical aren’t real peers.
Pro Tip: Split your benchmark comparisons by branded versus non-branded traffic before you draw any conclusions. Branded search inflates CTR and conversion numbers in ways that have nothing to do with your actual SEO performance, and blending the two hides real gains or real problems in your non-branded results.
For a deeper breakdown of how to categorize benchmarks before comparing them, SERPView’s guide to benchmark types walks through the selection logic in more detail.
How Do You Turn Benchmarks Into SMART SEO Targets?
A benchmark only becomes useful once you convert it into a target with a deadline attached. Here’s the sequence that keeps that conversion honest.
- Tie the target to a business outcome. Instead of “increase organic traffic 20%,” write “increase organic revenue by $X by tying non-branded conversion rate improvements to a 15% traffic lift.” Organic revenue and organic customer acquisition cost should sit above engagement and technical metrics in your reporting hierarchy.
- Set a real baseline window. Capture 30 to 90 days of pre-campaign data before you touch anything, and always compare using a 28-day year-over-year window to normalize seasonality rather than trailing 30-day snapshots that can be skewed by a single spike.
- Set timeline expectations by domain maturity. A brand-new domain in a competitive space can take 6 to 12 months to reach first-page visibility for meaningful terms. An established domain refreshing existing content often sees movement in 8 to 12 weeks.
- Watch for the pitfalls that quietly invalidate a benchmark. Over-indexing on vanity metrics like raw keyword count, comparing against a mismatched peer group, or drawing conclusions from a sample too small to be stable all produce false signals.
- Confirm you have the minimum viable data set. That means Google Search Console, GA4, a rank tracker export, and referring domain data, at minimum, before you present any benchmark comparison to a stakeholder.
Agencies benchmarking client performance run into the same baselining traps, which is worth reading if you manage more than one account.
What Should a Benchmark Monitoring Dashboard Include?
Benchmarking falls apart the moment your data lives in five disconnected tabs. A workable dashboard needs four data streams feeding it: Search Console for query and page-level performance, GA4 for conversion and engagement, a rank tracker for position history, and a backlink or business intelligence tool for authority context.
Build the reporting cadence in two layers. A monthly scorecard should lead with organic revenue and organic CAC, then support those numbers with CTR, traffic growth, and ranking distribution. A weekly exception report should flag anything abnormal: pages losing clicks fast, sudden CTR drops, or Core Web Vitals regressions that need attention before the monthly review.
Statistic Callout: Google Search Console caps most standard exports at 1,000 rows per query, which is often not enough data to spot ranking-tier shifts across a large site with thousands of tracked keywords. SERPView removes that ceiling by consolidating multiple GSC properties into one view and supporting exports up to 50,000 rows, which matters directly when you’re trying to hold a full historical benchmark data set rather than a truncated sample.
That data depth shortens the window to prove SEO’s return. When you can show a full ranking distribution shift across thousands of keywords instead of a capped sample, the case for continued investment gets a lot easier to make in a quarterly business review.
Practitioner Perspective: What Good Benchmarking Actually Looks Like
The most common reporting mistake isn’t picking the wrong metric. It’s presenting a single month’s number with no baseline and no peer context, then treating the resulting reaction as a verdict. Good benchmarking runs on cadence: a monthly scorecard for trend, a quarterly review for topical-authority and strategy shifts, and ad-hoc digs the moment an exception report flags something odd. For more on framing that cadence around real KPIs, the SERPView blog is worth a look.
— Utsav Chopra
Operationalize Your Benchmarks With SERPView
Comparing your numbers against industry midpoints is only step one. The harder problem is holding enough historical, multi-property data to make that comparison mean something, and that’s exactly where a standard Search Console export runs out of room. SERPView consolidates every property you manage into one dashboard and unlocks up to 50,000 rows of exportable data, so you’re benchmarking against your own full ranking history instead of a 1,000-row sample.

A few features built directly for this kind of work: query counting by ranking tier so you can see your positions 1–3, 4–10, and 11–20 distribution at a glance, shared dashboards for reporting the monthly scorecard to stakeholders without exporting a spreadsheet, and custom annotations to mark algorithm updates or site changes directly on your historical trend lines. Start a trial with an SEO analytics platform that offers extensive data exports to build your first benchmark dashboard from real, unlimited-row data instead of a capped export.
Sources
- SEO Statistics 2026 | Rankings, Traffic & ROI Data | Searchlab
- How to Measure SEO Success: The Complete KPI Framework - Firestarter SEO
- SEO Benchmarks by Industry (2026 Data) | MetricNexus
- Google ranking systems guide
FAQ
What Are the Most Important SEO Benchmarks to Track?
The core set is click-through rate, organic traffic growth year over year, organic conversion rate, engagement metrics like bounce rate and session duration, keyword ranking distribution across positions 1–20, and Core Web Vitals scores.
What Is the 80/20 Rule in SEO?
It generally refers to the idea that a small share of pages or keywords, often around 20%, drive the majority of organic traffic and conversions, which is why ranking distribution across tiers matters more than tracking every keyword equally.
What Are Common SEO KPIs for Reporting?
The strongest KPI hierarchy leads with business outcomes like organic revenue and organic customer acquisition cost, then supports those with engagement metrics and technical metrics like Core Web Vitals.
What Types of Benchmarking Exist for SEO Programs?
Analysts typically use industry benchmarking against sector midpoints, competitive benchmarking against direct competitors, historical benchmarking against your own past performance, and best-practice benchmarking against technical standards like Core Web Vitals thresholds.
How Often Should You Review SEO Benchmarks?
A monthly scorecard covering business and engagement metrics, paired with a quarterly strategy review for topical authority and comparator changes, keeps benchmark tracking accurate without overreacting to short-term noise.
Recommended
Ready to unlock your full GSC potential?
SERPView helps you access all your Google Search Console data without limitations. Start your free trial today.
Get Started Free