
Enterprise SEO Reporting That Proves Revenue Using 50,000 Row Exports
SERPView Team
SEO Analytics

The one requirement every enterprise SEO report must meet is proving SEO’s contribution to revenue or pipeline. Everything else, non-brand organic sessions, share of voice, Core Web Vitals, is a supporting cast member. Get the headline metric right, pair it with audience-specific dashboards, document your data sources, and stick to a reporting cadence, and you have a report leadership will actually read and act on.
TL;DR:
- Enterprise SEO reporting must directly link organic performance metrics to revenue or pipeline, using attribution methods that reflect business outcomes.
- Key KPIs include revenue or influenced pipeline figures, non-brand organic traffic, share of voice, and conversion rates segmented by search intent, supported by operational diagnostics.
- Dashboards should be tailored for different audiences: executive one-pagers for leadership, strategic views for VPs, and detailed operational dashboards for SEO teams, all maintaining consistent structure.
- Platforms like SERPView support scalable data exports, cross-domain aggregation, and integration with BI tools, enabling comprehensive analysis and governance at enterprise scale.
- Regular cadence involves weekly operational reviews, monthly leadership updates, and quarterly executive reports, with clear ownership, version control, and documentation of metric definitions.
Table of Contents
- What Makes Enterprise SEO Reporting Different?
- What Core KPIs Belong in an Enterprise SEO Report?
- How Should You Build Dashboards for Different Audiences?
- What Should an Enterprise SEO Platform Actually Support?
- How Often Should Enterprise SEO Reports Be Delivered?
- How Do Practitioners Meet These Reporting Standards?
- Three Steps to Fix Your Enterprise Reporting This Quarter
- See How SERPView Handles Enterprise SEO Reporting
- Sources
- FAQ
What Makes Enterprise SEO Reporting Different?
Enterprise SEO reporting is not the same discipline as tracking rankings for a 40-page brochure site. Once you’re managing thousands or millions of URLs across multiple domains, subdomains, or regional properties, the reporting problems change shape entirely. You’re no longer asking “did we rank higher this week?” You’re asking which of 12 business units drove organic pipeline, whether a migration on one subdomain tanked visibility on another, and how you explain that to a CFO who thinks in quarterly revenue, not keyword positions.
Scale breaks the tools most people learned SEO reporting on. A standard Google Search Console export caps at 1,000 rows in the UI and gets unwieldy fast once you’re dealing with enterprise catalogs or multi-market content. You need a way to see patterns across tens of thousands of queries and pages at once, not a sample.
Scale also breaks the “one dashboard fits all” assumption. A single spreadsheet that satisfies a content team lead will bore a CMO and confuse a legal reviewer checking for compliance annotations. Enterprise SEO reporting means building separate views that map to separate decisions, not forcing every stakeholder through the same screen.
The requirement underneath all of it: every metric in an enterprise report needs a line back to a business outcome. That’s the real difference between standard and enterprise reporting.
- Standard SEO reports track rankings, traffic, and technical health for a single site or a handful of pages.
- Enterprise SEO reports connect organic performance to revenue, pipeline, or a defined proxy metric, across multiple properties, for multiple audiences, on a fixed schedule.
- The failure mode to avoid is a report that’s technically accurate but organizationally useless because nobody asked what decision it’s supposed to inform.
Enterprise reporting should lead with business outcomes rather than rankings, structured as a one-page executive headline backed by an appendix of diagnostics. That structure, headline first, detail behind, is the backbone of everything in this article.
What Core KPIs Belong in an Enterprise SEO Report?
Start with headline outputs, because that’s what determines whether your report gets fifteen seconds of attention or fifteen minutes. Organic revenue or pipeline sits at the top. If you can’t attribute revenue directly, report an influenced-pipeline range instead, and say so plainly. A cost-per-acquisition proxy and, where you have the data, an organic-driven customer lifetime value figure rounds out the executive tier.
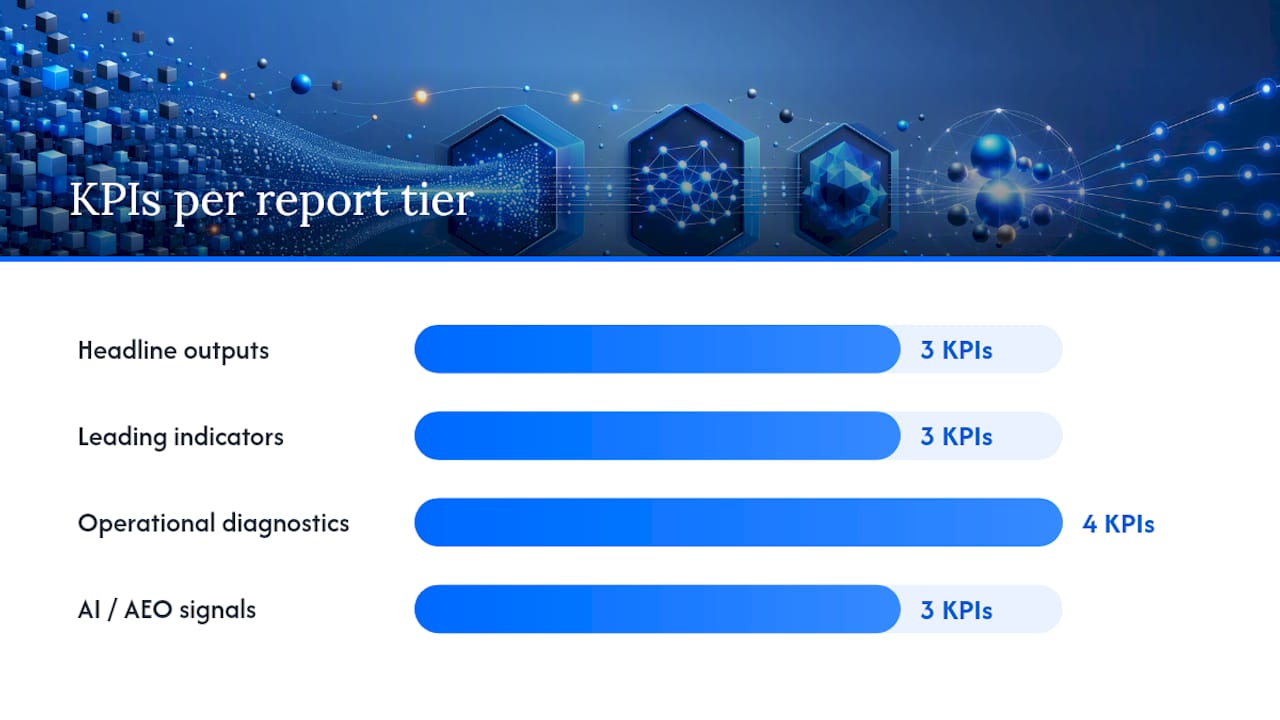
Below that sit your leading indicators, the numbers that predict where the headline metric is heading before it moves. Non-brand organic traffic matters more than total organic traffic because it isolates growth you actually earned rather than growth from people who already knew your name. Share of voice within your priority topic clusters tells you whether you’re gaining or losing ground against the field. Conversion rate segmented by search intent (informational versus transactional queries) tells you whether traffic quality is improving or just volume.
Then come operational diagnostics, the layer that explains why the top two tiers moved. Index coverage, winners and losers by URL, Core Web Vitals, and crawl health belong here. These numbers matter enormously to your SEO team and mean almost nothing to a VP unless something has broken badly enough to threaten the headline number.
- Headline outputs: organic revenue/pipeline, CAC proxy, LTV where available
- Leading indicators: non-brand organic sessions, share of voice by cluster, conversion rate by intent
- Operational diagnostics: index coverage, page-level winners and losers, Core Web Vitals, crawl health
- AI/AEO signals: citation frequency in AI answers, referral traffic from AI platforms, tracked directionally
A tiered reporting claim, direct attributed revenue as the floor, an influenced-pipeline range in the middle, and directional leading indicators on top, is more defensible and more trusted by executives than a single blended number that overstates certainty. Say an attributed amount with a broader influenced-pipeline range rather than pretending you can trace every dollar back to a single search click.
AI visibility deserves its own line item, but treat it carefully. AI overviews and answer engines are reshaping visibility in ways that don’t yet have mature attribution models. Report citation counts and referral sessions from AI platforms as a parallel channel, note your measurement window and assumptions in a footnote, and resist the urge to assign it a precise revenue figure until the tracking methodology catches up with the channel itself.
Statistic Callout: Reports that separate a hard revenue floor from a broader influenced-pipeline range tend to survive executive scrutiny better than single blended figures, because they show you understand the limits of your own attribution model.
Pro Tip: Label every AI-visibility metric with the word “directional” in the report itself. It sets expectations before anyone asks you to defend a number the tooling can’t yet fully support.
How Should You Build Dashboards for Different Audiences?
The mistake most teams make is building one dashboard and hoping it works for everyone. It never does. Operational and executive dashboards should share the same underlying data source but present entirely different metrics, cadences, and detail levels. Leak operational noise into an executive view and you lose the room in the first thirty seconds.
The executive one-pager should contain exactly one headline metric, three supporting tiles, one sentence of narrative explaining what moved and why, and a short list of next actions. Executive reports that prioritize revenue/pipeline alongside a short narrative and explicit next steps get read; reports that open with a wall of charts get skimmed and forgotten.
The leadership view sits one layer down, useful for marketing directors and VPs who need more than a headline but don’t want the raw operational feed. It should show trajectory over time, content performance by cluster, a winners-and-losers summary, and a rolling forecast.
The operational cockpit belongs to the SEO team itself: daily winners and losers by URL, an indexing status feed, and cluster-level rank trend lines. This is where you diagnose problems before they become headline-metric problems.
| Dashboard | Primary audience | Core content | Typical cadence |
|---|---|---|---|
| Executive one-pager | C-suite, board | Revenue/pipeline, 3 tiles, one insight sentence, next actions | Monthly or quarterly |
| Leadership view | VPs, marketing directors | Trajectory, content performance, winners/losers, forecast | Monthly |
| Operational cockpit | SEO managers, analysts | Daily winners/losers, indexing feed, cluster rank trends | Weekly or daily |
Whatever layout you choose, freeze it. Swap in new numbers every period, but keep the skeleton unchanged, readers build literacy and trust faster when the report format stays consistent rather than being redesigned every quarter. An agency-style operational dashboard built around this same principle works whether you’re managing one enterprise property or dozens of client accounts.
- Freeze the layout for at least two quarters before revisiting it.
- Keep the same metric definitions across periods, even if you improve the underlying data pipeline.
- Version-control any change to a definition and note the change date in the report itself.
What Should an Enterprise SEO Platform Actually Support?
Procurement teams evaluating enterprise SEO platforms tend to focus on feature lists and miss the structural requirements that determine whether a platform survives contact with real enterprise scale. Gartner’s enterprise SEO platform reviews consistently point to reporting scalability and integration depth as the deciding factors buyers weigh most heavily, more than any single flashy feature.
Scalability comes first. You need cross-domain rollups that let you view performance across every property in one place, export limits well beyond the standard 1,000 rows (up to 50,000 rows makes deep keyword and page-level analysis possible without sampling), and historical retention that goes back far enough to spot seasonal and algorithm-driven patterns rather than just the last 90 days.
Automation and templating come next. Scheduled exports that land in the right inbox without a human triggering them, white-label reporting for agencies managing multiple client accounts, and API access for teams that want to pull data into their own systems rather than living inside a vendor’s UI.
Segmentation and taxonomy support matters more than most buyers realize until they hit the wall. You need topic-cluster grouping, custom filters by device and country, and query counting by ranking tier so you can answer “how many keywords moved from position 11 to page one this month” without exporting raw data into a spreadsheet and doing it by hand.
BI compatibility rounds out the technical checklist. Most enterprise teams run their executive dashboards through a BI layer rather than a native vendor UI, so connectors for Looker Studio, Power BI, or Tableau matter as much as the platform’s own reporting screens. A Search Console to Looker Studio connection is a common pattern here, and raw CSV or Parquet export support is the fallback that keeps you from ever being locked in.
- Cross-domain rollups across every property you manage
- Export limits high enough for real keyword-level analysis, not samples
- Scheduled, automated report delivery and white-label options
- Cluster-level segmentation and custom filtering by device, country, and rank tier
- Native connectors to Looker Studio, Power BI, or Tableau, plus raw file export
- Access roles, annotation logging, and an audit trail for governance
Governance is the piece that gets skipped in vendor demos and then regretted a year later. Role-based access control, the ability to leave annotations on the timeline when something changes (a migration, an algorithm update, a redesign), and an audit trail showing who changed what and when, all of it matters once more than three people touch the same dataset. Microsoft Excel and Power BI still handle a surprising share of this governance layer in practice, stitched together with whatever export the primary platform allows.
How Often Should Enterprise SEO Reports Be Delivered?
Cadence should match the decision-making rhythm of each audience, not the other way around. Run operational reporting weekly, since the team diagnosing crawl errors or content decay needs fresh data more often than leadership does. Deliver the leadership view monthly, timed to align with broader marketing reporting cycles. Reserve the executive review for quarterly delivery, matched to the board or leadership meeting calendar where SEO’s contribution actually gets discussed.
- Assign an owner to every recurring project line. A status table with project name, current status, and expected impact keeps accountability visible, and someone specific needs their name next to each row.
- Freeze the report structure and version-control your metric definitions. If you change how “organic revenue” is calculated, note the change date and the reason, so a spike or drop six months later doesn’t get misread as a real trend shift.
- Build a short runbook for when the headline number moves unexpectedly. Check for a tracking error first, then an algorithm update, then a real business shift, in that order, before drafting an explanation for leadership.
That runbook step matters more than it sounds. Most unexpected headline-metric swings turn out to be tracking or attribution issues, not real performance changes, and chasing the wrong explanation in front of executives once is usually enough to damage trust in the entire report for months. Custom annotations tied directly to your reporting timeline make that first diagnostic step much faster, because you can immediately see whether a migration or algorithm update lines up with the date the number shifted.
How Do Practitioners Meet These Reporting Standards?
Meeting enterprise reporting requirements is less about finding the perfect template and more about wiring the right infrastructure once and refusing to rebuild it every quarter. That principle runs through every recommendation in this article, and it’s worth naming directly because it’s the part most teams underinvest in.
Author expertise matters here too. A report is only as credible as the person defending it in the room, so enterprise teams increasingly attach a named owner and their role directly to the reporting process, not just to the report’s footer.
Platform choice is where the infrastructure argument gets tested. SERPView addresses the GSC row-limit problem directly by supporting up to 50,000 rows of exportable data instead of the standard 1,000, which matters enormously once you’re doing keyword or page-level analysis across an enterprise catalog. Shared dashboards with white-label branding let agencies and internal teams present the same underlying data to different audiences without rebuilding the report from scratch each month, and customizable filters by device, country, and rank tier support exactly the segmentation the platform-requirements checklist above calls for.
- 50,000-row exports replace the standard 1,000-row GSC ceiling for deeper keyword and page analysis
- Shared dashboards with custom branding support the audience-separation principle from earlier in this article
- Pre-built reports for cannibalization, CTR benchmarking, and content decay map directly onto the operational diagnostics tier
- Historical tracking and algorithm-update overlays support the runbook step for explaining unexpected metric swings
A report is only as strong as the infrastructure behind it. Enterprise teams that wire their data sources once, freeze their report structure, and revisit definitions deliberately rather than accidentally, consistently produce reports that survive executive scrutiny.
Three Steps to Fix Your Enterprise Reporting This Quarter
If your enterprise SEO reporting feels scattered right now, don’t try to fix everything at once. Three moves, done in order, will get you most of the way there.
First, pick your headline metric and write down exactly how you calculate it. Revenue if you can attribute it directly, an influenced-pipeline range if you can’t. Document the attribution window and whether brand queries count, and don’t skip this step because it feels administrative. It’s the foundation everything else sits on.
Second, wire the four minimum data sources, Search Console, analytics, CRM, rank tracker, and freeze an executive template before you touch a second metric. A report built on three sources and one clean template beats a report built on seven sources and no consistent structure.
Third, put a monthly review on the calendar and assign a named owner to each recurring project and to the data definitions themselves. Reporting that nobody owns drifts within two quarters, and drift is what turns a trusted report into a disputed one.
— Utsav Chopra
See How SERPView Handles Enterprise SEO Reporting
SERPView is built for the exact gap this article describes: the point where Google Search Console’s 1,000-row limit stops being an inconvenience and starts hiding real performance data. Instead of exporting samples and stitching them together by hand, you get up to 50,000 rows per pull, which is enough to run genuine page-level and keyword-level analysis across an enterprise catalog rather than guessing from a slice of it.

The platform maps directly onto the checklist covered here. Shared dashboards with white-label branding let you build the executive one-pager once and the operational cockpit once, then keep both live without rebuilding them every reporting cycle. Custom filters handle the device, country, and cluster segmentation your leadership view needs, and query counting by ranking tier gives you the exact “how many keywords moved to page one” number that usually takes an analyst an afternoon to calculate manually.
If you’re rebuilding your reporting stack this quarter, start with the Google Search Console glossary entry to confirm which metrics you’re currently missing, then set up a shared dashboard to see how a 50,000-row export changes what your next executive report can actually say.
Sources
For building or auditing your own process, start with the executive SEO reporting template for report structure, the enterprise SEO metrics and dashboard guide for KPI selection, and Power BI’s documentation for connecting your data sources to a BI layer.
- Enterprise SEO Storytelling: Metrics, Reports & Dashboards
- Enterprise SEO Reporting: Dashboards | The Business Rover
- Google AI overviews coverage and reporting implications
- Power BI (Microsoft)
FAQ
What Is the 80/20 Rule in SEO?
Applied to enterprise reporting, it means roughly 20% of your metrics, revenue/pipeline, non-brand organic, and share of voice, drive 80% of the decisions leadership makes, so those belong on the executive page while everything else stays in the appendix.
What Is Enterprise SEO?
Enterprise SEO is search optimization and reporting at the scale of thousands or millions of URLs across multiple domains or business units, where reporting must map to specific stakeholders and connect directly to revenue or pipeline rather than rankings alone.
What Should an SEO Report Include?
At minimum, a headline revenue or pipeline figure, non-brand organic performance, index coverage and crawl health, page-level winners and losers, and a documented attribution window; a platform like SERPView can generate most of this directly from a shared dashboard.
Can I Do My Own SEO Audit?
Yes, a basic technical audit covering crawlability, indexing status, and Core Web Vitals is manageable in-house using GSC data and a technical audit checklist, though enterprise-scale audits usually benefit from a platform that can export beyond the standard 1,000-row limit.
How Often Should Enterprise SEO Reports Be Updated?
Run operational dashboards weekly, leadership dashboards monthly, and executive reviews quarterly, keeping the same report structure across each cycle so leadership can track trends without relearning the format every time.
Recommended
Ready to unlock your full GSC potential?
SERPView helps you access all your Google Search Console data without limitations. Start your free trial today.
Get Started Free