
How to Use SEO Report Filters for Diagnostic Analysis
SERPView Team
SEO Analytics

Split branded from non-branded queries first, then filter that non-branded set to positions 5 through 20 and sort by impressions. This single move separates traffic your marketing already earns from what your SEO actually discovers, and it exposes exactly which pages have a title or meta description that undersells their ranking. Everything else — page-level filters, device splits, date comparisons — builds on top of that first cut.
TL;DR:
- Filtering branded queries with exact or regex patterns can accurately separate brand from non-brand traffic, improving insights into discovery versus brand recognition.
- Applying filters to positions 5 through 20 for non-branded queries highlights pages with declining CTR due to title or meta description issues.
- Running content decay and cannibalization audits with a 12-month comparison helps identify aging content and overlapping pages that cannibalize traffic.
- Automating filters through APIs and scheduling regular workflows ensures data accuracy and efficiency, especially when managing multiple properties.
- Overly narrow or complex filters risk data distortion, so always verify filtered totals against unfiltered baselines and test regex patterns before full deployment.
Table of Contents
- What Are SEO Report Filters and Why Do They Matter?
- How Do You Filter Branded Versus Non-Branded Queries?
- Which Diagnostic Filter Workflows Should You Run First?
- What Regex Patterns Work Best for Query Grouping?
- How Do You Automate Filtered Reports With the GSC API?
- What Should a Monthly Filtered Reporting Schedule Look Like?
- What Common Mistakes Undermine Filtered SEO Reports?
- How Do You Operationalize This at Scale?
- What Most Reporting Advice Gets Wrong About Filters
- Run These Filtered Workflows Without Hitting a Row Limit
- Where to Verify Filter Syntax and API Details
- Sources
- FAQ
What Are SEO Report Filters and Why Do They Matter?
SEO report filters are the criteria you apply to search performance data, query, page, device, country, date, so you isolate one variable at a time instead of staring at an undifferentiated wall of numbers. Without them, a report is just a spreadsheet of averages that hides more than it reveals. With them, you can answer specific questions: is this drop a mobile problem or a desktop problem? Is this traffic branded or earned? Google Search Console gives you the raw dimensions to do this, and it now supports regex-based custom filters and comparisons directly in the Performance report, which changed how much diagnostic work you can do without exporting anything.
Here are the core dimensions you’re working with, and how their operators behave:
- Query: filter by “contains,” “exact match,” or “regex” to isolate keyword patterns, brand terms, or product families.
- Page: filter by URL contains or regex to isolate directories, templates, or specific landing pages.
- Device: split into desktop, mobile, and tablet to catch performance gaps that site-wide numbers mask.
- Country: isolate markets when you’re troubleshooting international visibility or hreflang issues.
- Date: compare two ranges (commonly year-over-year or pre/post algorithm update) to spot trend shifts.
- Search type: separate web, image, and video results, since blending them skews CTR and position averages.
The operator you choose changes your totals in ways that trip people up. “Contains” is forgiving but can pull in false positives (a “notContains” filter for your brand name might still miss a misspelling). “Exact match” is precise but brittle. Regex gives you the most control, but a single unescaped character can silently exclude rows you meant to include, and Search Console won’t warn you when that happens. Always sanity check filtered totals against the unfiltered baseline before you trust a chart.
How Do You Filter Branded Versus Non-Branded Queries?
Branded and non-branded queries answer completely different questions, and blending them into one report is one of the most common ways SEO reporting misleads clients. Branded queries tell you people already know your business and searched for it by name. Non-branded queries tell you whether your SEO is actually generating new discovery. Google Search Console recently added a native branded query filter that lets you split these directly in the Performance report and in API exports, which removes a step agencies used to handle manually with regex.
You have three approaches to building the split, in order of reliability:
- Exact match on the brand name works only if your brand has no common misspellings or close variants.
- Contains filters catch more variants but risk pulling in unrelated queries that happen to share a substring.
- Regex is the strongest option for real-world brand names, since you can capture variants and misspellings in one pattern, something like
brand|brnad|brands?for a fictional example, adjusted to your actual name.
Once you’ve split brand from non-brand, build these five query groups, since they map to the intent segments most reports actually need:
- Brand — your name, product names, and common misspellings.
- Local intent — queries with city names, “near me,” or regional modifiers.
- Informational — question-based queries (“how,” “what,” “why”) and top-of-funnel research terms.
- Transactional — queries with commercial modifiers like “buy,” “price,” “cost,” or “vs.”
- Competitor mentions — queries that include a competitor’s name alongside your category term.
When you’re excluding internal noise, combine “contains” and “notContains” filters so login pages, support queries, and other navigational clutter don’t dilute your brand-health numbers.
Pro Tip: Build your regex query groups once, save them as templates in your reporting tool, and reuse them across every client with the same industry profile. Rebuilding the same pattern from scratch every month wastes time you should spend on analysis.
Which Diagnostic Filter Workflows Should You Run First?
Four filter stacks handle the majority of diagnostic questions an SEO analyst gets asked. Each one takes under five minutes to run once you know the sequence, and each answers a different kind of “why did this happen” question.
- CTR gap workflow. Filter to non-branded queries, position 5 through 20, then sort by impressions change over your comparison window. Pages ranking in that range with impressions holding steady but clicks falling usually have a title tag or meta description that doesn’t match search intent. A healthy CTR at position 8 to 10 typically falls in the mid-single digits; anything noticeably below your site’s average for that position band is worth rewriting.
- Content decay check. Compare a 12-month window against the prior 12 months, filtered by query group or page directory. Look for pages with declining clicks despite stable or improving position, that pattern usually means the content itself has aged out relative to what’s now ranking above it.
- Cannibalization audit. Filter the Pages tab by a specific query group, then check whether more than one URL is picking up impressions for the same terms. Two pages splitting the same non-branded query’s traffic is a consolidation candidate almost every time.
- Algorithm impact assessment. Run a date comparison bracketing a known update, filtered to non-branded queries, then segment by device. A drop concentrated on mobile after an update usually points to a different cause than a drop spread evenly across devices.
Diagnostic filter stacks with a clear sort metric are the fastest way to triage large drops or CTR anomalies, because they force you to look at one variable’s movement instead of a blended average that hides the actual cause.
What Regex Patterns Work Best for Query Grouping?
Regex is the most powerful tool available for tracking topic clusters, seasonal modifiers, or brand variants, but it’s also the fastest way to silently corrupt a report if you’re not careful. Query groups built with regex should be paired with sampling and directory-level testing before you apply them to a live client dashboard.
A few patterns worth keeping in your library:
- Brand variants:
brandname|brnadname|brand namecatches spacing and typo variants in one pass. - Product family OR clauses:
productA|productB|productCgroups an entire line without writing separate filters for each SKU. - Local intent modifiers:
near me|in [a-z]+ city|localcatches geographic intent phrasing without hardcoding every city name.
Test any new pattern on a small subfolder or a single week of data before rolling it out. Regex has three common failure modes: overmatching (a loose pattern like .*app.* will also catch “happy” and “apple”), unescaped special characters (a literal period in a domain name needs to be escaped as \.), and missing whitespace handling (forgetting that “buy now” and “buynow” are different strings). Each of these silently changes your totals without throwing an error, which is exactly why sampling matters more with regex than with any other filter type.
Pro Tip: Run your regex pattern against last month’s data first and manually spot-check twenty rows. If even two or three don’t belong, tighten the pattern before it goes into a recurring report.
How Do You Automate Filtered Reports With the GSC API?
The Search Console UI caps you at 1,000 rows and doesn’t scale past a handful of properties. Once you’re managing more than two or three sites, manual filtering in the interface stops being viable, and the GSC API becomes essential for agencies that need consistent, reproducible exports.
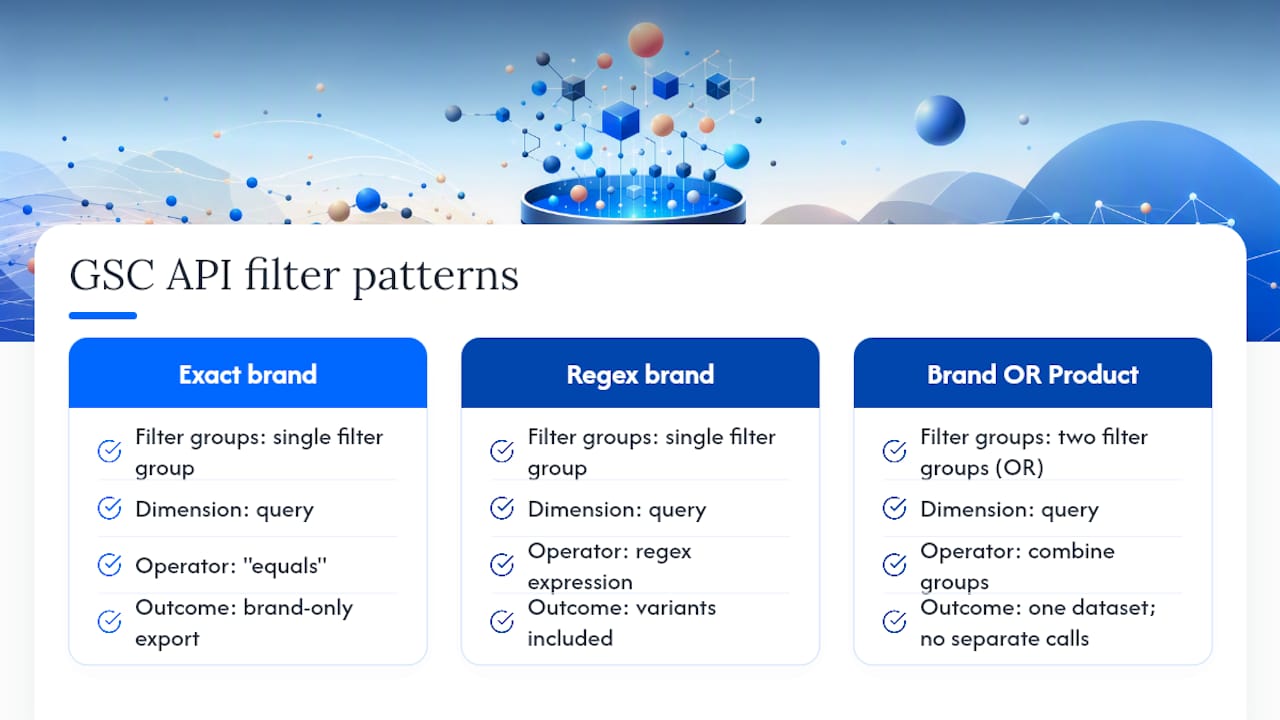
The API uses a DimensionFilterGroups parameter, an array of filter objects, each specifying a dimension, an operator, and an expression. Supported operators include contains, equals, notContains, and regex-based matching, and you can combine multiple groups for AND logic or stack filters within a group for OR logic.
A typical export for exact brand performance passes a single filter group with the query dimension, the “equals” operator, and your brand string. A broader brand health export swaps that for a regex expression covering variants. And an OR-logic brand-plus-product export combines two filter groups in the same request, pulling brand mentions and flagship product queries into one dataset without two separate calls.
Combine your date range and query filter in the same DimensionFilterGroups payload rather than pulling raw data and filtering afterward in a spreadsheet. It keeps your scheduled exports consistent from month to month, and it cuts the post-processing work down to almost nothing. For row-limit workarounds, paginate your requests using the API’s startRow parameter rather than trying to force more rows through a single call, which the interface won’t let you do at all.
What Should a Monthly Filtered Reporting Schedule Look Like?
Filtered reporting works best as a routine, not a one-off exercise you run when a client asks a question. A structured weekly and monthly cadence catches problems before they become client emergencies instead of surfacing them a quarter late.
| Week | Filtered run | Trigger threshold |
|---|---|---|
| Week 1 | Branded split, year-over-year | Brand impressions down more than 20% |
| Week 2 | CTR gap, positions 5 to 20, non-branded | CTR meaningfully below position-average benchmark |
| Week 3 | Content decay, 12-month comparison by directory | Clicks falling despite stable position |
| Week 4 | Cannibalization audit, plus technical/device segments | Two or more URLs competing for the same query group |
For deliverables, keep the visual exports simple: a trend chart for branded versus non-branded clicks, a table of top queries ranked by impressions change, and a flagged-pages list for anything crossing a decay or cannibalization threshold. Junior analysts can run this exact sequence without reinterpreting the workflow each month, which is the entire point of turning it into a checklist rather than a judgment call. A custom reporting filter setup built once and reused monthly saves far more time than rebuilding filters from scratch every cycle.
What Common Mistakes Undermine Filtered SEO Reports?
Filtered data is only useful if it’s accurate, and a few recurring mistakes quietly break that accuracy without triggering any obvious error.
- Always verify your filtered total against the unfiltered baseline. If a “non-branded” filter still shows 90% of total clicks, something in your brand pattern is too narrow.
- Watch for truncated or anonymized values (marked with a tilde,
~) in comparison views. Treat those rows as directional, not exact. - Document every filter, date range, and granularity setting you used. A report you can’t reproduce next month isn’t a report, it’s a snapshot.
- Don’t over-filter. Stacking five conditions on a small dataset often leaves you with a sample too thin to draw conclusions from.
- When testing a new filter combination, run it on a subfolder or single property first, the same discipline that applies to segmenting Core Web Vitals by directory or template to catch issues that site-wide averages hide.
How Do You Operationalize This at Scale?
This entire workflow only holds up if the person running it understands both the mechanics of search data and where the common failure points are. Utsav Chopra writes regularly on search analytics and reporting filters, including deeper breakdowns of how search analytics filters work for SEO analysts and KPI-driven SEO reporting for teams building out a full reporting stack.
SERPView was built around exactly this problem: a unified dashboard across every property you manage, exports up to 50,000 rows instead of the Search Console interface’s 1,000-row ceiling, and customizable filters you can save and schedule instead of rebuilding by hand. Certifications and client case studies for specific implementations are being added as they roll out.

What Most Reporting Advice Gets Wrong About Filters
Most guidance on this topic treats filters as a formatting choice, something you apply after the analysis is done, to make a report look more organized for a client meeting. That’s backward. The filter is the analysis. Deciding to split branded from non-branded before you look at a single trend line changes which conclusions are even available to you.
The conventional advice also tends to stop at the UI. Search Console’s interface is fine for a single property with modest traffic, but it breaks down fast for agencies managing multiple sites, which is exactly the point where automation through the API stops being a nice-to-have and starts being the only way to keep reports accurate month over month.
If I had to prioritize one thing for a reader who’s never built a real filter stack before, it’s this: don’t start with regex. Start with the branded split and the CTR-gap filter at positions 5 through 20. That combination alone answers more client questions than any dashboard full of vanity metrics ever will. Build complexity only after that foundation is running on a schedule, not before.
— Utsav Chopra
Run These Filtered Workflows Without Hitting a Row Limit
The workflows in this article all run into the same wall eventually: Search Console’s interface caps you at 1,000 rows, and once you’re juggling filters across multiple properties, that ceiling shows up fast. SERPView consolidates every property into one dashboard and exports up to 50,000 rows per pull, so the branded splits, CTR-gap filters, and cannibalization audits above run on your full dataset instead of a truncated sample.

The platform’s customizable filters save as reusable templates, so the monthly checklist you just read doesn’t have to be rebuilt by hand every cycle, and its shared dashboard feature lets you hand a live, filtered view to a client instead of exporting a static screenshot. If you’re still relying on manual exports from Google Search Console, start by mapping your current filter stack onto SERPView’s dashboard and see how much of that monthly routine collapses into a scheduled report.
Where to Verify Filter Syntax and API Details
For exact filter syntax and comparison limits, Google’s own Performance report help documentation is the primary reference. For programmatic exports, the DimensionFilterGroups API reference covers operator syntax in detail. Search Engine Land’s coverage of the branded query filter rollout explains the reasoning behind Google’s own approach to brand segmentation.
Sources
- Performance report (Search results): Advanced filtering and comparison - Search Console Help
- How GSC’s branded query filter changes SEO reporting and analysis
- Get Google organic search report for selected date range, dimensions and metrics (API reference) — DimensionFilterGroups examples
FAQ
Can ChatGPT Do an SEO Audit?
ChatGPT can help interpret filtered data you’ve already pulled, spotting patterns in a CTR-gap export or drafting hypotheses for a content decay report, but it can’t independently query Search Console or verify ranking data, so it works best as an analysis assistant layered on top of real filtered exports, not a replacement for them.
What Are the Top SEO Audit Tools?
Google Search Console remains the primary free source for query and page-level data, while platforms like SERPView extend that data past the 1,000-row limit with unified dashboards and customizable filters for teams managing multiple properties; pairing filtered reporting with automated site audits covers both the search-performance side and the technical-crawl side.
What Should an SEO Report Look Like?
A useful SEO report leads with a filtered, segmented view, branded versus non-branded, CTR gaps by position, and flagged decay or cannibalization candidates, rather than an unfiltered dump of total clicks and impressions that hides which pages actually need attention.
How Often Should You Rerun These Filters?
Run the branded split and CTR-gap filter every two weeks, and reserve content decay and cannibalization audits for a monthly cycle, since those patterns develop more slowly and a monthly comparison window gives you enough data to act on with confidence.
Recommended
Ready to unlock your full GSC potential?
SERPView helps you access all your Google Search Console data without limitations. Start your free trial today.
Get Started Free