
The Role of Custom Reporting Filters for SEO Agencies
SERPView Team
SEO Analytics

TL;DR:
- Custom reporting filters help transform raw search data into targeted, repeatable insights aligned with business KPIs. Using presets across properties ensures consistency, saves time, and improves report accuracy in multi-property SEO management. Proper governance involves naming conventions, regular audits, and focusing on building a small set of effective, question-driven filters.
Custom reporting filters let you turn raw search data into targeted, repeatable answers to specific business questions. Rather than just trimming volume, they refine report outputs to isolate exactly the subset of data that maps to a client KPI — without altering the underlying dataset. The single most important action you can take right now: create and save business-aligned filter presets at the report level, mapped to each client’s core KPIs.
Here is what that looks like in practice:
- Define the question first. A filter built around “Which branded queries lost CTR after a SERP feature change?” produces a sharper report than one built around “show me less data.”
- Use Google Search Console as your data source, but recognize its 1,000-row export limit constrains multi-property analysis. Serpview removes that ceiling, offering significantly larger export sizes across consolidated properties.
- Save filter presets at the report level so every team member pulls the same view, every time.
- Map each preset to a named KPI (CTR, impressions, click share) so stakeholders know what question the report answers.
Table of Contents
- What is the difference between filtering and highlighting?
- Where do custom filters make the biggest difference in multi-property SEO?
- How do you design effective custom reporting filters step by step?
- Filter templates you can copy and apply across properties
- How should teams govern, share, and version their filter libraries?
- What mistakes do teams make with reporting filters?
- Implementation checklist and timeline for rolling out filters across properties
- How Serpview supports this filter playbook in practice
- Key Takeaways
- Why the filter conversation in SEO is missing its most important half
- Serpview gives agencies a faster path to filtered, client-ready reports
- Useful sources
- FAQ
What is the difference between filtering and highlighting?
Filtering removes rows from the report view entirely, narrowing focus to a defined subset. Highlighting keeps all rows visible but visually de-emphasizes the ones outside your selection, preserving context for relationship checks. Both have a place in multi-property SEO work, and confusing them is one of the most common sources of misread dashboards.
A practical example: if you filter to US mobile traffic only, every non-US and non-mobile row disappears. If you highlight US mobile traffic instead, you can still see how that segment compares to desktop or international traffic in the same view. Use filtering when you need a clean, client-ready report. Use highlighting when you are still exploring relationships between segments.
Filter scope matters just as much as filter logic. Widget-level filters override page-level and report-level filters in most professional analytics platforms. If a widget has its own filter applied, the broader report filter will not override it — a frequent cause of “missing” rows that analysts spend hours debugging.
Common filter types to know:
- Inclusion/exclusion filters — show or hide rows matching a value
- Range filters — bound a metric (impressions > 100, CTR < 2%)
- Boolean logic filters — AND narrows; OR broadens
- Property/scoped filters — apply only to a specific property or workspace
Where do custom filters make the biggest difference in multi-property SEO?
The custom reporting benefits of well-designed filters show up most clearly when you are managing more than three properties simultaneously. Here are the use cases where they pay off fastest:
- Agency dashboards: Roll up performance across all client properties into a single executive view. Saved filters let you switch between client contexts without rebuilding the report.
- Client reporting: Scope filters to each client’s branded queries, target pages, and primary device type. Deliver a report that answers their question, not a generic data dump.
- Cannibalization detection: Isolate queries linked to multiple pages within the same property to surface overlap. A filter combining query contains [term] AND page count > 1 flags the problem immediately.
- CTR benchmarking: Filter by impression band (e.g., impressions > 500) to compare CTR across pages at similar visibility levels. This removes small-sample noise from the analysis.
- Content decay: A rolling 90-day filter on click and impression trends identifies pages losing ground before rankings drop visibly.
- Device and country segmentation: Separate mobile and desktop performance by country to catch regional UX issues that aggregate data masks.
For client-facing reports, use saved filters — they are consistent, version-controlled, and reduce the risk of a team member accidentally pulling the wrong date range. Reserve ad-hoc quick filters for internal exploration, where speed matters more than repeatability. You can learn more about mapping filter results to client strategy to get the most from each use case.
How do you design effective custom reporting filters step by step?
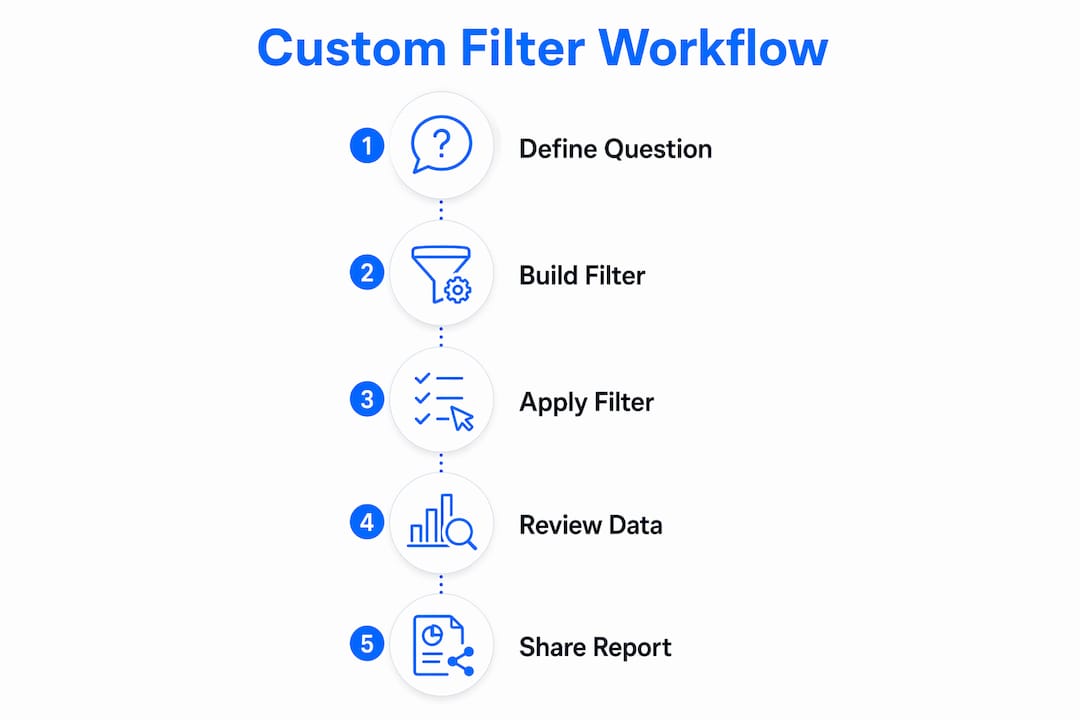
- Write the business question. Before touching any filter interface, write one sentence: “Which pages lost CTR versus SERP feature changes in Q1?” That sentence defines every dimension and operator you will need.
- Select your dimensions and metrics. Choose from property, page URL, query, device, country, date range, and SERP feature. Prefer dimensions that are stable across properties — page URL patterns and device type hold up better than session-based segments.
- Choose operator logic. AND narrows results (Query contains “brand” AND Device = “mobile” returns only branded mobile queries). OR broadens them (Device = “mobile” OR Device = “tablet” captures all handheld traffic). Nested boolean logic — (A AND B) OR C — handles complex multi-property queries but requires careful testing.
- Decide scope. Widget-level for a single chart, page-level for a tab, report-level for the full dashboard. Remember: widget-level overrides everything above it.
- Name and version the filter. Use a consistent pattern:
[ClientCode]_[KPI]_[Scope]_[YYYYMM]_v1. Example:ACME_CTR_Mobile_202601_v1. Add a “last validated” tag so the team knows when it was last checked. - Validate before delivery. Run a sanity query against a known data point. Check sample size — filters returning fewer than 100 impressions produce unreliable CTR figures. Use cross-highlighting to confirm the filtered segment makes sense in context. Compare against a previous export to catch regression.
Pro Tip: Save role-based filters for client delivery and reserve quick filters for analyst exploration. Mixing the two in a shared dashboard creates version-control headaches and inconsistent client reports.

Filter templates you can copy and apply across properties
These logical snippets are ready to adapt. Each includes a minimum threshold to avoid small-sample noise.
| Template Name | Filter Logic | Minimum Threshold |
|---|---|---|
| Cannibalization detector | Query contains [term] AND Page URL count > 1 | 100 impressions per query |
| CTR drop alert | Date range: current vs. prior period AND Impressions > 500 AND CTR delta negative | 500 impressions |
| Content decay (90-day) | Rolling 90-day window AND Clicks declining AND Impressions > 100 | 100 impressions |
| Mobile-US focus | Device = “mobile” AND Country = “United States” | 100 clicks |
| High-value keyword rollup | Query contains [priority term] AND Position ≤ 8.2 | 50 clicks |
Before-filter example row: Page /blog/seo-tips, Query “seo tips”, Impressions 4,200, Clicks 38, CTR 0.9%, Position 8.2 (all devices, all countries).
After applying Mobile-US focus filter: Same page, Impressions 1,100, Clicks 22, CTR 2.0%, Position 7.4. The mobile-US segment outperforms the aggregate — a finding that the unfiltered view buries.
Additional notes on filter logic:
- Use OR logic when grouping device types:
Device = "mobile" OR Device = "tablet"captures all handheld sessions. - For long-tail keyword rollups, combine a query-length condition with a position range to isolate high-intent, low-competition terms.
- Always set a minimum impressions threshold. Filters returning tiny samples skew CTR and position averages significantly.
How should teams govern, share, and version their filter libraries?
Governance is where most agencies lose consistency. A filter built by one analyst in January looks nothing like the one a second analyst builds in March for the same client — unless you have a shared naming convention and a review schedule.
Naming convention (recommended):
[ClientCode]_[KPI]_[Scope]_[YYYYMM]_v[N]
Example: GLOBEX_Impressions_Desktop_202603_v2
- Editor-only (static) filters lock the baseline logic so viewers cannot accidentally change the report’s scope. Use these for all client-facing dashboards. Static filter properties configured by editors are not modifiable by report viewers.
- Quick filters are viewer-interactive and useful for internal exploration. Never use them as the primary filter on a client report.
- Audit schedule: Review client report filters monthly (check relevance, sample size, and operator logic). Review the full filter library quarterly (retire stale filters, update date ranges, flag schema changes).
- Sharing: Store filter templates in a shared workspace. When a filter is promoted from draft to production, update the version tag and log the change date.
Pro Tip: Add a “last validated” tag to every saved filter. A filter built for a site architecture that no longer exists will silently return wrong data — the tag makes stale filters visible at a glance.
What mistakes do teams make with reporting filters?
- Overfiltering: Applying too many AND conditions produces a dataset too small to be meaningful. Fix: broaden one condition at a time and enforce minimum impression thresholds before drawing conclusions.
- Incorrect boolean nesting:
Query contains "brand" AND Page = "/product" OR Device = "mobile"evaluates differently than(Query contains "brand" AND Page = "/product") OR Device = "mobile". Test with a sample query before saving. - Ignoring widget-level overrides: A widget filter silently overrides your report-level filter. If rows go missing, inspect the applied filters panel at the widget level first.
- Stale saved filters: A filter scoped to
/old-blog/after a URL migration returns zero rows and no error. Add a “last validated” date to every saved filter and check it during monthly audits. - Misreading highlighted vs. filtered views: Presenting a highlighted view as a filtered report to a client inflates the apparent dataset. Confirm which mode is active before exporting.
Implementation checklist and timeline for rolling out filters across properties
| Phase | Key Tasks | Estimated Hours |
|---|---|---|
| Discovery | Audit existing reports, document client KPIs, inventory properties | 4–8 hrs |
| Template build | Design filter logic, write naming conventions, build 3–5 core templates | 6 hrs |
| Pilot test | Apply templates to 2–3 properties, validate against known data points | 3–5 hrs |
| Rollout and training | Deploy to all properties, train team on naming and governance | 4–6 hrs |
| Monitoring and audits | Monthly filter reviews, quarterly library audits | 1–2 hrs/month |
Steps to keep costs down:
- Start with the two or three highest-impact templates (CTR benchmarking and content decay cover most client questions).
- Reuse filter libraries across clients with similar site architectures — swap the client code prefix, keep the logic.
- Automate validation by scheduling a weekly sanity-check export against a known baseline row.
- Pull in Google Analytics and Search Console data through a consolidated multi-property view to reduce the number of separate filter sets you need to maintain.
The biggest cost driver is boolean complexity. Simple inclusion/exclusion filters take minutes to build. Nested multi-property boolean rules with date-comparison logic can take an hour per template to validate correctly.
How Serpview supports this filter playbook in practice
Serpview directly implements the capabilities this guide recommends. Here is the feature mapping:
- Saved filter presets: Serpview’s custom filters let you save and reuse filter configurations across properties, eliminating manual reconfiguration on every report run.
- Shared dashboards: The shared dashboard feature delivers live SEO data to clients and team members without requiring them to log in or rebuild the view.
- Multi-property consolidation: Serpview consolidates Google Search Console data across multiple properties into one workspace, removing the 1,000-row GSC limit and surfacing up to 50,000 rows per export.
- Query counting by ranking tier: Serpview’s query counting feature supports rollup filters by ranking bracket, directly enabling the high-value keyword rollup template above.
- Custom annotations: Pair filter outputs with custom annotations to mark algorithm updates or site changes, so CTR drops are interpreted in context rather than in isolation.
The first step: connect your properties in Serpview, import your saved filter templates, and create one shared dashboard per client. Most teams reach their first clean, filtered client report within a single working session.
Key Takeaways
Custom reporting filters are the difference between a report that answers a business question and one that just displays data. Build your filter library around client KPIs, govern it with naming conventions and audit schedules, and use a platform that supports saved presets and multi-property consolidation.
| Point | Details |
|---|---|
| Filters answer questions, not just reduce data | Build every filter around a written business question before choosing dimensions or operators. |
| Filter scope determines what you see | Widget-level filters override page and report-level filters; always inspect the applied filters panel when rows go missing. |
| Governance prevents drift | Use a naming convention (ClientCode_KPI_Scope_YYYYMM_vN) and validate saved filters monthly to catch stale logic. |
| Saved filters cut reporting time | Saved presets eliminate manual reconfiguration each cycle, reducing human error and keeping client reports consistent. |
| Serpview for multi-property agencies | Serpview consolidates properties, supports saved filter presets, and exports up to 50,000 rows — purpose-built for agency filter workflows. |
Why the filter conversation in SEO is missing its most important half
Most guides on reporting filters focus entirely on the mechanics: how to set an AND condition, how to scope a filter to a widget. That is useful, but it misses the harder problem. The real challenge in multi-property SEO is not building a filter — it is building the right filter and keeping it right across six months of client work, team turnover, and site architecture changes.
Agencies that treat filter governance as an afterthought end up with a library of 40 saved filters, half of which no longer match the site they were built for. The naming convention looks like a suggestion rather than a standard. Nobody knows which version is current. And the client report quietly returns wrong data because a URL migration happened in October and nobody updated the page-scoped filter.
The fix is not more filters. It is fewer, better-governed filters tied to explicit business questions, reviewed on a schedule, and owned by a named person. Start with three templates that cover 80% of your client questions. Build the governance habit before you build the library. That sequence is what separates agencies that use filters as a productivity tool from those that use them as a complexity generator.
Serpview gives agencies a faster path to filtered, client-ready reports
Managing filters across dozens of properties in spreadsheets means rebuilding the same logic every reporting cycle. Serpview replaces that with a unified workspace where saved filter presets, shared dashboards, and multi-property data up to 50,000 rows are all in one place. The concrete advantage: your team configures a filter once, shares it across properties, and delivers a consistent client report without manual rework.

Setup checklist to your first filtered report in Serpview:
- Connect your Google Search Console properties to Serpview.
- Import or build your core filter templates (start with CTR benchmarking and content decay).
- Create a shared dashboard and scope it to the client’s primary KPIs.
- Invite your team and assign editor vs. viewer permissions.
- Export your first filtered report — most teams complete this in under an hour.
Start your first multi-property filter setup and see a clean, client-ready report without the spreadsheet overhead.
Useful sources
- Power BI filter types — Microsoft Learn: Authoritative breakdown of automatic, manual, include/exclude, and drillthrough filter types — useful for understanding filter behavior across analytics platforms.
- About filter properties — Google Cloud / Looker Studio: Official documentation on static vs. quick filter properties, editor permissions, and how filters interact with report data.
- Working with filter precedence — Broadcom tech docs: Explains widget > page > report-level precedence — essential reading before diagnosing missing rows.
- Configuring filters for custom reports — Docebo Help: Practical walkthrough of OR logic, scoped filters, and saved filter configuration in a production reporting environment.
- Filtering data on a report — MicroStrategy Help: Detailed reference for boolean qualification syntax (AND/OR operators) — useful when building complex multi-property filter logic.
- Custom Reports FAQ — Matomo: Covers AND/OR operators in report filters and how segments interact with custom report definitions.
FAQ
What does a custom reporting filter actually do?
A custom reporting filter isolates a specific subset of your data to answer a defined business question, without changing the underlying dataset. It removes rows that fall outside your criteria so the report reflects only the segment you care about.
How is filtering different from highlighting in SEO dashboards?
Filtering removes non-matching rows from view entirely; highlighting keeps them visible but visually de-emphasizes them. Use filtering for client-ready reports and highlighting when you need to compare a segment against the full dataset.
What is the right naming convention for saved filters?
A reliable pattern is ClientCode_KPI_Scope_YYYYMM_vN — for example, ACME_CTR_Mobile_202601_v1. This makes filters sortable, version-trackable, and easy to audit during monthly reviews.
How does Serpview support multi-property filter workflows?
Serpview consolidates Google Search Console data across multiple properties into one workspace, supports saved filter presets, and exports up to 50,000 rows — removing the 1,000-row GSC limit that makes multi-property filtering impractical in native Search Console.
How often should saved filters be reviewed?
Review client report filters monthly to check relevance and sample size. Run a full library audit quarterly to retire stale filters and update any that reference outdated URL structures or site architectures.
Recommended
Ready to unlock your full GSC potential?
SERPView helps you access all your Google Search Console data without limitations. Start your free trial today.
Get Started Free