
How Engagement Metrics Relate to Search Rankings
SERPView Team
SEO Analytics
TL;DR:
- Google measures user engagement through its own first-party data, not third-party analytics like GA4.
- Optimizing for search intent, improving page speed, and increasing CTR better influence rankings than focusing on bounce rates or session durations.
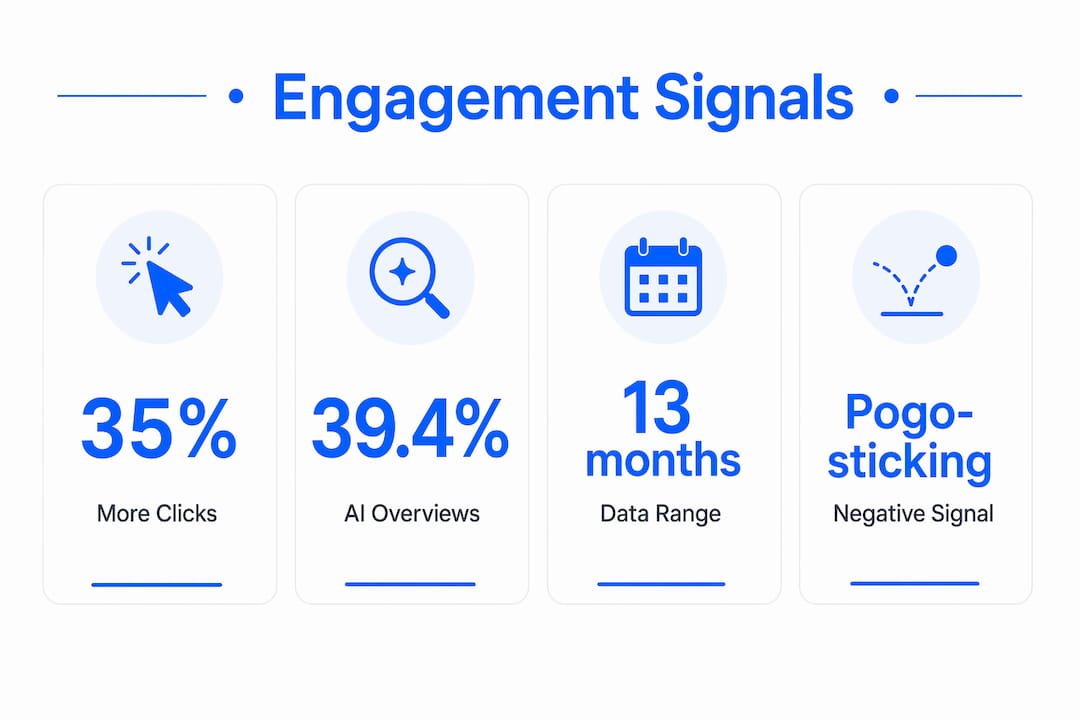
Engagement metrics, as measured directly by Google, are behavioral signals that determine whether a page satisfies user intent well enough to maintain or improve its search ranking. Understanding how engagement metrics relate to search requires separating two distinct categories: Google’s own first-party signals captured through SERP interactions, and third-party analytics metrics computed by tools like GA4. Google’s NavBoost ranking system analyzes up to 13 months of click behavior, dwell time, and pogo-sticking data to evaluate result quality. AI Overviews now appear in nearly 40% of informational queries, reshaping how visibility and clicks interact. Knowing which signals Google actually reads changes how you should build and measure content.
How engagement metrics relate to search: Google’s first-party signals
Google does not read your GA4 dashboard. It reads its own data, collected at the point where users interact with search results and browse the web through Chrome.

The primary mechanism is NavBoost. Google’s NavBoost system uses first-party data including SERP click-through rate, dwell time, and pogo-sticking, aggregated across thousands of users over months. That population-level aggregation is what prevents individual manipulation from gaming the system.
Google classifies clicks into four behavioral categories:
- Long clicks: Users spend 30 or more seconds on a page before returning to the SERP. These signal satisfaction and push rankings up.
- Medium clicks: Users spend a moderate amount of time. These are neutral signals.
- Short clicks / pogo-sticking: Users return to the SERP quickly after clicking. This is the strongest negative signal Google uses.
- Strong negative clicks: Users click a result and immediately bounce back, then click a competitor. These trigger ranking drops.
Google evaluates click quality by distinguishing “good clicks” from “bad clicks” at scale. A single user bouncing from your page changes nothing. Thousands of users doing it consistently causes a measurable ranking penalty.
The core principle: Google’s engagement signals are behavioral, population-level, and first-party. They measure whether real users found what they were looking for. No third-party analytics tool can replicate or substitute for this data, and no individual session manipulation can move the needle.
AI Overviews appear in 39.4% of informational queries, and pages cited in those overviews gain 35% more organic clicks. This means AI citation is now a parallel engagement amplifier. Pages that satisfy both behavioral and semantic criteria earn more visibility and more clicks simultaneously.
Why third-party analytics metrics are proxies, not ranking signals
GA4 bounce rate and time on page are useful. They are not ranking factors. Google’s ranking systems do not read third-party analytics data because those metrics are computed by external JavaScript and never supplied to Google’s ranking infrastructure.
This distinction matters because many SEO practitioners spend time trying to lower bounce rates as if Google can see them. It cannot. What Google sees is pogo-sticking on the SERP, which is a related but separate measurement.
Here is how to use third-party metrics correctly:
- Bounce rate as a diagnostic. A bounce rate below 40% often signals intent mismatch or a technical loading failure. Engagement rates below 40% frequently indicate content that fails to satisfy user intent, sometimes because of slow page speed rather than content quality.
- Engagement rate as a content health check. A healthy engagement rate from organic traffic falls between 55% and 75%. Rates below that threshold point to pages worth auditing for intent alignment.
- Time on page as a satisfaction proxy. Long session durations suggest users are consuming content. Short durations on content-heavy pages suggest a mismatch between what the title promised and what the page delivered.
- Pageviews as a vanity check. Traffic spikes above 150% in visits frequently do not correlate with revenue gains. High pageviews without conversion or intent fulfillment are a warning sign, not a success metric.
Pro Tip: Set up GA4 segments that isolate organic traffic from other channels before drawing conclusions about engagement. Blended traffic data produces misleading engagement benchmarks that can send your SEO analysis in the wrong direction.
The relationship between third-party engagement data and search rankings is indirect. Poor engagement metrics in GA4 often predict pogo-sticking behavior on the SERP. Fixing the underlying cause, whether that is slow load times, misleading titles, or thin content, reduces pogo-sticking and improves Google’s first-party signal quality.
How engagement metrics affect SEO strategy and ranking performance
Knowing the difference between first-party and third-party signals changes your optimization priorities. The goal is not to make your analytics look better. The goal is to make users more satisfied, which naturally produces better signals in both places.
Reduce pogo-sticking by matching intent
Pogo-sticking is the strongest negative signal Google uses. The fix is not technical. It is editorial. Your page must deliver exactly what the search query implied. Use Serpview’s search intent glossary to categorize queries correctly before writing content.
Improve CTR with better SERP presentation
Click-through rate is a first-party signal Google measures directly. A compelling title and meta description increase CTR, which feeds NavBoost positive data. Use the Serpview SERP Simulator to preview how your snippet appears before publishing.
Fix technical performance before content
Core Web Vitals correlate strongly with engagement outcomes. Poor page speed causes users to leave before consuming any content, triggering pogo-sticking through no fault of the content itself. Technical fixes here produce direct engagement improvements.
The table below maps common engagement problems to their root causes and the correct fix:
| Symptom | Root cause | Correct fix |
|---|---|---|
| High pogo-sticking | Intent mismatch | Rewrite content to match query intent |
| Low dwell time | Slow page load | Improve Core Web Vitals scores |
| Low CTR | Weak title or description | Rewrite meta title and description |
| Low engagement rate | Thin or off-topic content | Expand content depth and relevance |
| High traffic, low conversion | Vanity metric focus | Add conversion intent signals to content |
Pro Tip: Track branded keyword performance separately from non-branded queries. Return visitors searching your brand name are a strong behavioral signal of content satisfaction, and monitoring that trend gives you a leading indicator of engagement quality before rankings shift.
Monitor AI Overview citations as part of your visibility strategy. Pages cited in AI Overviews gain significantly more organic clicks, which feeds more positive behavioral data back into NavBoost. Use Serpview’s AI Overview Checker to identify which pages are being cited and which are not.
How to interpret engagement data alongside E-E-A-T and content completeness
Engagement signals do not operate in isolation. Google’s evaluation combines behavioral data with content quality filters, including E-E-A-T (Experience, Expertise, Authoritativeness, and Trustworthiness) and semantic completeness.
Strong engagement without authority has limited ranking upside. A page that users love but that lacks credible authorship signals will plateau. Conversely, a highly authoritative page with poor behavioral signals will also underperform. Both dimensions must be present.
The table below compares how these two signal categories interact:
| Signal type | What Google measures | Impact on ranking |
|---|---|---|
| Behavioral (NavBoost) | Clicks, dwell time, pogo-sticking | Direct ranking adjustments |
| E-E-A-T | Author credentials, site authority, citations | Quality filter and trust threshold |
| Semantic completeness | Topic coverage, multi-modal content | AI Overview eligibility |
| Core Web Vitals | Page speed, layout stability, interactivity | Engagement prerequisite |
AI Overview citations occur in over a third of informational queries, and inclusion yields 35% more organic clicks. That click volume feeds NavBoost with more positive behavioral data, creating a compounding advantage for pages that satisfy both semantic and behavioral criteria.
Engagement metrics historically measured attention but not purchase probability or genuine behavior change. The future of content measurement lies in tracking whether content actually shifts user behavior, not just whether users clicked. For SEO practitioners, this means prioritizing audience search behavior analysis over raw engagement counts.
Google’s population-level pattern analysis combines all these signals across millions of queries. No single page optimization produces instant ranking changes. Consistent behavioral satisfaction across your content portfolio is what moves rankings over time.
Key takeaways
Engagement metrics influence search rankings through Google’s first-party behavioral signals, not through third-party analytics data from tools like GA4.
| Point | Details |
|---|---|
| NavBoost drives ranking adjustments | Google uses 13 months of click, dwell, and pogo-sticking data to adjust rankings. |
| Third-party metrics are proxies | GA4 bounce rate and time on page diagnose problems but do not directly influence Google’s ranking systems. |
| Pogo-sticking is the key negative signal | Users returning quickly to the SERP is the strongest behavioral penalty Google applies. |
| Intent match is the primary fix | Aligning content with search intent reduces pogo-sticking and improves dwell time simultaneously. |
| AI Overview citations amplify engagement | Pages cited in AI Overviews gain 35% more organic clicks, feeding more positive data into NavBoost. |
The metric that actually matters in 2026
Most SEO practitioners I talk to are optimizing the wrong thing. They are watching GA4 bounce rates and session durations as if Google has access to that dashboard. It does not. Focusing on satisfying search intent is more effective than tuning bounce rates, because intent satisfaction is what produces the behavioral signals Google actually measures.
The misconception that you can “game” engagement metrics for ranking gains is persistent and damaging. NavBoost aggregates behavior across thousands of users. One session, one bot, or one internal traffic spike does not move it. What moves it is consistently delivering pages that answer the query completely and quickly.
What I have found works in practice is treating GA4 engagement data as a diagnostic layer, not a ranking lever. When a page shows low engagement rate in GA4, I treat that as a signal to investigate intent alignment and page speed, not as a ranking problem in itself. The ranking problem, if there is one, lives in NavBoost. The GA4 data just helps me find where to look.
Shifting from vanity metrics to behavior-shifting metrics is the right direction. Repeat visitor rate, conversion intent signals, and AI Overview citation status are the metrics worth tracking in 2026. They reflect genuine user satisfaction, which is the only thing that produces durable ranking gains.
— Utsav Chopra
Serpview gives you the data to act on engagement signals
Understanding the relationship between engagement and search rankings is only useful if you can see the data clearly. Serpview consolidates your Google Search Console data across multiple properties into a single dashboard, with up to 50,000 rows of query data instead of the standard 1,000-row limit.

Use Custom Annotations to mark site changes and correlate them with ranking and CTR shifts over time. The Query Counting by Ranking Tier feature shows you exactly how many queries sit in each ranking band, giving you a clear picture of where engagement improvements will have the most impact. When you can see your data at this level of detail, moving from diagnosis to action becomes straightforward.
FAQ
What engagement signals does Google actually use for ranking?
Google uses SERP click-through rate, dwell time, and pogo-sticking data collected through its own systems and Chrome browser behavior. These signals feed the NavBoost ranking system, which aggregates data over 13 months at a population level.
Does Google use GA4 bounce rate as a ranking factor?
No. Google’s ranking systems do not read GA4 or any third-party analytics data. Bounce rate is computed externally and is invisible to Google’s ranking infrastructure.
What is pogo-sticking and why does it hurt rankings?
Pogo-sticking occurs when a user clicks a search result and returns quickly to the SERP, signaling dissatisfaction. It is the strongest negative behavioral signal in NavBoost and causes direct ranking penalties when it occurs consistently across many users.
How does AI Overview inclusion affect engagement and search visibility?
Pages cited in AI Overviews gain 35% more organic clicks than non-cited pages in the same query. That additional click volume feeds more positive behavioral data into NavBoost, reinforcing ranking performance.
What is a healthy engagement rate for organic search traffic?
A healthy engagement rate from organic traffic falls between 55% and 75%. Rates below 40% typically indicate intent mismatch, slow page speed, or content that fails to deliver on the query’s implied promise.
Recommended
Ready to unlock your full GSC potential?
SERPView helps you access all your Google Search Console data without limitations. Start your free trial today.
Get Started Free