
Keyword Data Sampling Problems: Examples for SEO Analysts
SERPView Team
SEO Analytics
Keyword data sampling problems examples show up in every major SEO tool you use daily, and a single extraction is rarely the full picture. Google Trends draws its Search Volume Index (SVI) from a replaceable sample, meaning two identical queries run on different days can return different time series. Google Search Console suppresses low-impression queries below its anonymization threshold and caps API exports at roughly 50,000 rows per request, biasing results toward head terms. Google Keyword Planner rounds volumes into coarse bands unless you access the Google Ads API directly. The immediate fix: treat any single-extraction report as provisional, run a reproducibility check before acting on the data, and save your extraction metadata (date, filters, seed) every time.
Quick actions to take right now:
- Re-extract your top 50 Google Trends queries on two separate days and compare peak SVI values.
- Pull 30 daily Search Console exports and stack them against a single 30-day export to spot suppressed queries.
- Compare total Search Console clicks against GA4 organic sessions for the same period to detect systematic undercounting.
- Record extraction date, property type, and filter settings for every export you plan to act on.
Key Takeaways
Single-extraction keyword reports are provisional signals, not ground truth. Re-extract, use APIs, and document your methodology before advising stakeholders on content or budget decisions.
| Point | Details |
|---|---|
| Single extractions are provisional | Re-extract key queries on different days before acting; treat one pull as a hypothesis, not a fact. |
| GSC suppresses long-tail queries | Anonymization thresholds and the ~50,000-row export cap bias results toward head terms; daily-merged exports recover more tail coverage. |
| Averaging GT extractions compresses range | Multiple extractions reduce SVI noise but lower the apparent peak; adjust trend interpretation accordingly. |
| Save extraction metadata always | Record date, filters, property type, and seed for every export so findings are auditable and reproducible. |
| Serpview expands GSC coverage | Serpview consolidates multiple properties and surfaces up to 50,000 rows, reducing the head-term bias of standard UI exports. |
Table of Contents
- What do keyword data sampling problems actually mean for your data?
- Common sampling problems SEO analysts actually see
- Concrete examples and simulations you can run right now
- How to detect sampling problems in your own keyword datasets
- Mitigation strategies and analyst best practices
- How Serpview workflows reduce sampling risk
- Checklist for reporting sampling uncertainty to stakeholders
- What I’d check first in the first 30 minutes
- Serpview gives you reproducible, unconstrained exports
- Sources
- FAQ
What do keyword data sampling problems actually mean for your data?
Every search tool you rely on returns a sample, not the complete population of searches. Google processes billions of queries daily; returning raw counts for every keyword at every granularity would be computationally prohibitive and a privacy risk. So tools normalize, aggregate, and threshold the data before you ever see it.
Two error types matter here. The first is sampling variability: random chance means a different slice of traffic gets measured each time, producing slightly different numbers. The second is sampling bias: systematic factors, such as which users are tracked, which devices are included, or which queries clear the anonymization threshold, consistently skew results in one direction. Epidemiological research recommends aiming for at least a 60% completion rate from a sampling frame and checking non-respondent differences to quantify potential bias. The same logic applies to keyword data: when a large share of queries is suppressed or excluded, your visible dataset is not representative.
Google Trends normalizes raw counts into an SVI scaled 0–100. That normalization means you cannot compare absolute volumes across different queries or time windows without accounting for the rescaling effect. Search Console applies anonymization thresholds and row limits that shrink the visible keyword set. Serpview’s unified dashboard addresses this directly by consolidating data across multiple properties and surfacing up to 50,000 rows, giving you a much wider view of the common search data blind spots that standard GSC exports miss.
Statistic to keep in mind: Epidemiological guidance sets 60% as the pragmatic minimum completion rate before non-response bias becomes difficult to estimate. In keyword data terms, if a significant share of your long-tail queries is suppressed, your “sample” is already below that threshold for the tail.
Common sampling problems SEO analysts actually see
Understanding the categories helps you recognize them quickly in your own exports.
- Anonymization thresholds in Search Console: Queries with very low impressions are suppressed entirely. You never see them, which creates a long-tail blind spot that can mask entire topic clusters.
- Row and API export caps: The Search Console API returns up to roughly 50,000 rows per request. For large sites, that cap means the exported set skews toward high-impression queries, systematically underrepresenting the tail.
- Google Trends SVI extraction variability: Repeated extractions of the same query can yield different SVI series, especially for low-popularity terms. Averaging multiple extractions reduces noise but compresses the range, making peaks look smaller than they are.
- Keyword Planner volume bands: The UI returns coarse buckets (e.g., “1K–10K”) rather than precise counts. Accessing the Google Ads API’s KeywordPlanIdeaService returns more granular volumes, but requires authentication and quota management.
- Frame and coverage gaps: Cookie-blocked users, logged-out sessions, and device splits all exclude portions of the actual search population from panel-based or clickstream data sources.
- Non-response and selection effects: Third-party clickstream panels recruit from specific user pools. Those pools systematically differ from the broader search population, producing non-generalizable estimates if treated as ground truth.
Concrete examples and simulations you can run right now
These are reproducible steps, not hypotheticals.
Google Trends SVI simulation
- Open Google Trends and search for a moderately popular query (avoid mega-brands; aim for something with SVI peaks around 40–70).
- Export the weekly time series as a CSV. Record the peak SVI and the full range (max minus min).
- Repeat the extraction 10–20 times across different days or sessions.
- Average the SVI values for each week across all extractions.
- Compare the averaged series peak to the single-extraction peak.
Expected outcome: the averaged series will show a lower peak and a narrower range than any individual extraction. Cross-extraction correlation for high-popularity terms tends to be high; for low-popularity terms, you will see meaningful divergence.
| Extraction ID | SVI Peak | SVI Range | Correlation with Mean Series |
|---|---|---|---|
| Extraction 1 | 72 | 58 | 0.94 |
| Extraction 2 | 65 | 51 | 0.91 |
| Extraction 3 | 78 | 63 | 0.93 |
| Averaged series | 68 | 47 | 1.00 |
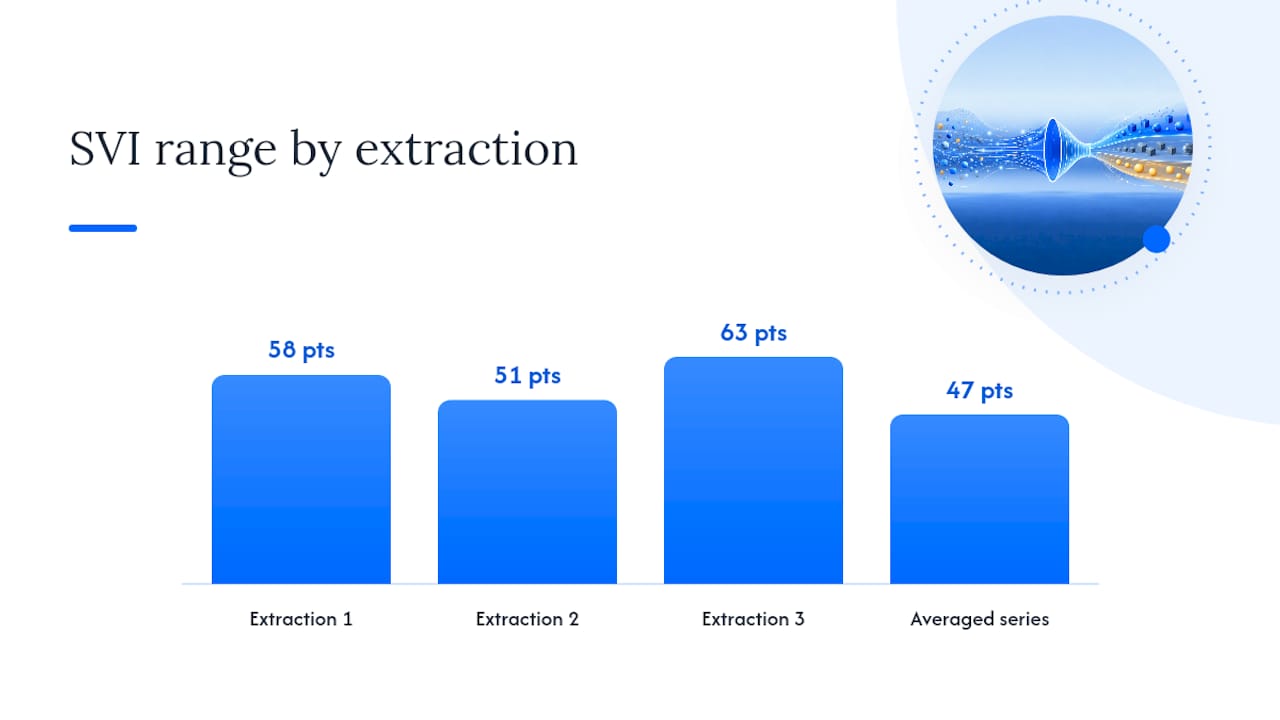
Note: these values are illustrative of the pattern described in simulation research on GT inconsistencies. Run your own extractions to get query-specific figures.
GSC export comparison
- Pull a single 30-day Search Console export via the API or Serpview’s bulk export.
- Pull 30 individual daily exports for the same period and merge them.
- Count unique queries in each dataset. The daily-merged set will typically surface queries that the 30-day aggregate suppressed due to the anonymization threshold.
- Note the difference in total query count and the share of clicks attributed to suppressed queries.
Keyword Planner vs. Google Ads API
The UI Keyword Planner returns volume bands. If your account has active ad spend, bands narrow slightly, but you still get ranges. Calling KeywordPlanIdeaService via the Google Ads API returns precise monthly search volumes for each keyword idea, subject to API quotas. For any keyword where the band spans an order of magnitude (e.g., “1K–10K”), the API call is worth the setup cost before you make a content investment decision.
How to detect sampling problems in your own keyword datasets
Run these checks before drawing conclusions from any keyword export.
- Re-extract on different days. Pull the same query set from Google Trends or Search Console on two separate days. If results differ materially, you have extraction variability.
- Compare GA4 organic sessions to Search Console clicks. A persistent gap (GA4 higher than GSC) often signals suppressed queries or session attribution differences. A gap larger than 10–15% warrants investigation.
- Inspect for missing long-tail terms. Cross-reference your GSC data limitations export against a keyword research tool. Queries present in the research tool but absent from GSC are likely below the anonymization threshold.
- Compare domain vs. URL-prefix property exports. Domain properties aggregate subdomains; URL-prefix properties are narrower. Differences between the two reveal canonicalization and grouping effects.
- Compute cross-extraction standard deviation. For your top 50 queries, calculate the standard deviation of SVI or click counts across multiple extractions. High standard deviation on low-volume terms is a direct signal of sampling noise.
- Bootstrap confidence intervals. For any proportion estimate (e.g., share of clicks from mobile), resample your export 1,000 times with replacement and compute the 2.5th and 97.5th percentile. That range is your working uncertainty band.
Practical flags to watch: sudden volatility in low-volume keywords across consecutive exports; many queries switching from zero to nonzero impressions between extractions; aggregated URL rows in GSC that combine content from multiple distinct pages.
Statistic: Search Console’s API caps exports at roughly 50,000 rows per request. For sites with large keyword footprints, that ceiling means the visible dataset is already a biased sample of the full query universe.
Mitigation strategies and analyst best practices
Prioritize these in order when time and resources are limited.
- Run reproducibility checks first. Re-extract before you act. Two extractions that agree give you confidence; two that diverge tell you to average more or use an API.
- Use APIs and bulk exports. The Search Console API, Google Ads API, and Serpview’s 50,000-row export all reduce the row-limit bias that the standard UI introduces. APIs require credentials and quota management, but the payoff in data completeness is substantial.
- Average multiple Google Trends extractions. For low-popularity terms, averaging reduces variance meaningfully. Accept that the averaged series will have a compressed range and adjust your trend interpretation accordingly.
- Use stratified or targeted oversamples for rare segments. If a specific device type, country, or query category is underrepresented, stratified sampling lets you oversample that segment and then weight results back to the population. Cluster sampling reduces precision (the design effect), so account for that in your sample-size planning.
- Apply weighting and design-effect adjustments. When you combine data from multiple sources or sampling frames, weight each source by its known coverage share. Ignoring the design effect from cluster samples overstates your precision.
Tradeoffs to keep in mind: averaging compresses range and can mask genuine spikes; API access takes setup time and quota budget; oversampling rare segments complicates weighting if not documented carefully.
Pro Tip: Sample from the post-clean dataset. Apply your deduplication, bot-filter, and canonicalization rules before you draw any sample. Sampling from raw data and then cleaning introduces selection effects that are nearly impossible to correct after the fact. Always save your extraction seed, date, and filter settings alongside the data file.
When to accept sample uncertainty: for directional trend analysis or content ideation, a single well-documented extraction is usually sufficient.
For advanced keyword research tactics that account for these sampling constraints, pairing your GSC exports with a structured query-expansion method helps you build a more representative keyword universe from the start.
How Serpview workflows reduce sampling risk
Serpview addresses the core export and aggregation constraints that make raw GSC data unreliable for granular analysis.
Platform capabilities:
- Consolidates Google Search Console data across multiple properties into a single unified view.
- Surfaces up to 50,000 rows per export, reducing the head-term bias that standard UI exports introduce.
- Supports custom annotations so you can tag extraction dates, filter settings, and algorithm update windows directly alongside the data.
- Provides pre-built reports for keyword cannibalization and CTR benchmarking, both of which depend on complete keyword-to-URL mappings that sampling can obscure.
- Tracks historical search performance over extended periods, enabling cross-period comparisons that reveal whether a trend is real or an extraction artifact.
Reproducible workflow:
- Connect both your domain property and URL-prefix properties to Serpview.
- Run a combined export for your target date range and save the export file with the date and filter settings in the filename.
- Run cohort splits by device and country, then compare totals to GA4 organic sessions for the same segment.
- Version and store each export so you have an audit trail when stakeholders ask why numbers changed between reports.
Checklist for reporting sampling uncertainty to stakeholders
Clear, honest reporting prevents decisions based on false precision.
- State your data source(s): Google Search Console (domain property), Google Trends (weekly, US), Google Keyword Planner (UI vs. API), or a consolidated Serpview export.
- Record extraction dates and filter settings: include the date range, country filter, device split, and any property-level settings.
- Note the number of extractions averaged: if you averaged five Google Trends pulls, say so.
- Disclose known thresholds and row limits: acknowledge that queries below the anonymization threshold are not visible and that exports are capped.
- Compare to GA4 totals: note any gap between GSC clicks and GA4 organic sessions and its likely cause.
- Recommend next actions: specify whether a follow-up API pull or additional extractions are warranted before a budget decision.
Example phrasing you can use directly:
“Search Console suppressed an estimated portion of long-tail queries in this 30-day export due to the anonymization threshold. We recommend a daily-merged export or a Serpview bulk pull to recover additional query coverage before finalizing the content plan.”
For visualizations: plot each individual extraction as a faint line and the averaged series as a bold line. That single visual communicates variability and central tendency simultaneously, without requiring stakeholders to understand sampling theory.
Pro Tip: When presenting Google Trends data to stakeholders, always show at least three individual extraction lines alongside the average. A single bold line looks authoritative; the faint lines behind it show the honest uncertainty range and prevent overconfident decisions.
What I’d check first in the first 30 minutes
When a keyword report looks off, here is the triage sequence that surfaces the problem fastest.
Compare total Search Console clicks to GA4 organic sessions for the same period. Next, re-extract your top 50 queries in Google Trends on two different days and count how many show a peak SVI shift greater than 10 points. If more than a handful do, you are dealing with extraction variability, not a real trend change.
Check for zero-to-nonzero switches: queries that showed zero impressions in one export but nonzero in another are almost certainly below the anonymization threshold in the first pull, not genuinely absent. If long-tail coverage matters for your project, request a bulk export or use Serpview consolidation and flag any keyword set where the tail represents more than 20% of your expected traffic before making content decisions.
Serpview gives you reproducible, unconstrained exports
Sampling artifacts in keyword data cost you real decisions: content investments based on suppressed long-tail signals, budget allocations built on coarse volume bands, and trend calls made from a single noisy extraction. Serpview removes the most common friction points in that workflow.

With Serpview, you consolidate Google Search Console data across all your properties, export up to 50,000 rows, and preserve a full audit trail with custom annotations for every extraction. The query counting feature surfaces keyword coverage across ranking tiers that standard GSC exports miss entirely. Pre-built reports for cannibalization and CTR benchmarking run on complete data, not a head-term-biased slice.
Start a Serpview trial and run your first reproducible bulk export today at Serpview.
Sources
- Sampling in epidemiological research: issues, hazards and pitfalls - PMC
- Simulating the inconsistencies of Google Trends data
- Why does Google Search Console aggregate and sample data in ways that make raw API exports unreliable for granular keyword-level trend analysis? - Vega SEO Talks
- Sampling guide — EGAP Methods
- Common sampling errors and consequences in study reporting
FAQ
What causes keyword data sampling problems in Google Search Console?
Search Console applies anonymization thresholds that suppress low-impression queries and caps API exports at roughly 50,000 rows per request, biasing the visible dataset toward head terms. Daily-merged exports or a consolidated tool like Serpview recover more of the long-tail query set.
How do you fix Google Trends SVI variability?
Re-extract the same query 10–20 times and average the SVI series across extractions. Averaging reduces noise, but accept that the averaged series will show a lower peak and narrower range than any single extraction.
When should you use the Google Ads API instead of Keyword Planner?
Use the Google Ads API’s KeywordPlanIdeaService whenever a Keyword Planner volume band spans a wide range and the decision depends on knowing whether volume is closer to the lower or upper bound. The API returns precise monthly volumes subject to quota limits.
How do you report keyword data uncertainty to stakeholders?
State your data source, extraction dates, number of extractions averaged, known thresholds, and any gap between Search Console clicks and GA4 organic sessions. Use phrasing like: “Search Console suppressed a portion of long-tail queries; we recommend a bulk export before finalizing the content plan.”
What is the fastest way to detect sampling bias in a keyword export?
Compare Search Console total clicks to GA4 organic sessions for the same period.
Recommended
Ready to unlock your full GSC potential?
SERPView helps you access all your Google Search Console data without limitations. Start your free trial today.
Get Started Free