
Save 5 to 10 Hours: Portfolio SEO Reporting Ops Playbook for Agencies
SERPView Team
SEO Analytics
Portfolio SEO reporting works when you consolidate verified data sources, run everything through a standardized KPI template, automate the pulls and delivery, and keep a strategist reviewing the output before it reaches a client. Skip any one of those pillars and reports either take too long to produce or become too unreliable to defend. This kind of structure relies on pulling multi-property data into one dashboard so the framework below actually holds up as you add clients.
TL;DR:
- Equipping your portfolio reports with verified data sources and regular checklists ensures reliability and prevents stale connections from corrupting insights.
- Proper onboarding involves confirming canonical domains, mapping accurate data properties, and validating rankings against manual checks, taking up to 8 weeks for full process integration.
- Build reports around outcome metrics like traffic, rankings, and conversions, emphasizing top-10 distribution and technical health over raw traffic counts.
- Automate data pulls with scheduled API exports, use anomaly alerts, and maintain live dashboards to catch issues early without relying solely on monthly manual reviews.
- Protect client data with scoped permissions, clear privacy communication, and industry-specific templates, while adding competitive context and handling anomalies transparently to enhance trust.
Table of Contents
- What Belongs on Your Portfolio Reporting Checklist?
- How Do You Onboard and Map Data Correctly?
- What KPIs and Template Sections Actually Scale?
- How Should You Automate Pulls and Set Reporting Cadence?
- How Do You Prevent Noisy or Inaccurate Data?
- What ROI Can You Expect From Automating Reports?
- How Do You Deliver Client-Facing Reports Professionally?
- What Privacy and Compliance Issues Come With Multi-Property Data?
- Should You Customize Templates by Client Type?
- How Do You Add Competitive Context to Portfolio Reports?
- How Do You Handle Data Anomalies and Inconsistencies?
- How Do You Train Your Team on Portfolio Reporting?
- Author Perspective: Trade-Offs and Why Human Review Still Matters
- How Serpview Fits This Playbook
- Further Reading and Implementation References
- Sources
- FAQ
What Belongs on Your Portfolio Reporting Checklist?
Before you automate anything, confirm your data foundation is sound. Run this checklist against every property in your portfolio, not just the newest client.
- Inventory your sources: Google Search Console (root property, not a subfolder), GA4, your rank tracker, a crawl tool, and a backlink data source.
- Verify canonical domains: confirm you’re connected to the actual production domain, not a staging environment or an old HTTP version.
- Confirm ownership and access levels: someone on your team needs verified admin access, not just viewer permissions inherited from a previous contractor.
- Lock attribution settings and date ranges: GA4 conversion events should match what the client’s team actually calls a conversion.
- Define your minimum deliverable fields: every client report needs an executive summary, top ranking movers, organic sessions, conversions, and a technical health snapshot, regardless of account size.
Pro Tip: Run this checklist quarterly, not just at onboarding. Clients change CMS platforms, migrate domains, and swap analytics setups more often than agencies expect, and a stale connection quietly corrupts every report downstream.
How Do You Onboard and Map Data Correctly?
Data-source misconfiguration is the single most common reason portfolio reports go wrong. Connecting a staging domain, an HTTP variant, or the wrong subdomain instead of the canonical property is a frequent technical audit mistake, and it’s often invisible until a client questions a number that doesn’t match their own analytics.
Work through onboarding in this order:
- Inventory the property and confirm which domain variant (with or without “www,” HTTP or HTTPS) is the one Google actually indexes.
- Confirm canonical ownership in Search Console and remove any duplicate or orphaned property that could pull stale data.
- Map the GA4 property to the correct website and verify the attribution model matches what the client reports internally.
- Set rank-tracking locale and device splits so mobile and desktop rankings aren’t blended into one misleading average.
- Run initial validation: pull a week of GSC clicks and impressions, compare them against your export, sample five URLs manually, and reconcile GA4 session counts against a raw GA4 report.
Agencies that build this into a repeatable process typically need 4 to 8 weeks to map workflows, wire connectors, and run parallel manual and automated reports before fully cutting over.
Pro Tip: Run manual and automated reports side by side for at least one full cycle before you trust the automated version alone. Discrepancies almost always trace back to a property mapping error, not a bug in your dashboard.
What KPIs and Template Sections Actually Scale?
A template that works for three clients breaks at thirty unless it’s built around outcome metrics rather than vanity numbers. Standardized templates and a shared taxonomy are what make portfolio insights comparable across sites instead of forcing you to reinterpret every client’s data from scratch.
Build every report around these sections:
- Executive summary (3 to 5 sentences): what happened, why, and what you’re doing about it.
- Ranking movers: keywords that gained or lost significant position, especially at the top-3 and top-10 boundary.
- Traffic and conversion trends: organic sessions layered against qualified conversions or revenue, never traffic alone.
- Ranking distribution: how many tracked keywords sit in each ranking tier, since a client jumping from position 14 to position 9 matters more than raw session counts suggest.
- Technical snapshot: crawl errors, index coverage, and Core Web Vitals status.
- Backlink summary: new links, lost links, and any toxic pattern worth flagging.
- Recommended next actions: one prioritized item, not five.
Favor qualified organic sessions and top-10 distribution over raw traffic or total keyword counts, which look impressive but rarely tell a client anything actionable. Keep a shared “commentary bank,” a running library of pre-written explanations for common patterns like seasonal dips or algorithm volatility, and pair it with exactly one prioritized action item per client. That combination keeps every report feeling personal without your strategists rewriting boilerplate every month.
How Should You Automate Pulls and Set Reporting Cadence?
The right stack pairs a live dashboard for internal monitoring with scheduled, white-labeled exports for client delivery. That’s the pattern behind most modern automated reporting setups: connectors and APIs handle the data pull, while a report builder handles formatted delivery.
In practice, this means:
- Schedule API pulls directly from GSC and GA4 rather than exporting manually each month.
- Use orchestration tools like n8n, Make, or Zapier when you need to route data between platforms that don’t talk to each other natively.
- Keep a live dashboard for ops so your team can catch problems in real time, and reserve scheduled branded PDF reports for formal client communication.
- Set anomaly alerts for sudden traffic drops, ranking collapses, or indexation issues so you’re not waiting for the monthly report to notice a problem.
A workable cadence looks like weekly automated health checks for your internal team, monthly client-facing reports, and quarterly strategy reviews where you step back from the numbers and talk direction. This is also where the Serpview dashboard approach earns its place, since it’s designed to sit between raw API data and a client-ready export without forcing you to stitch tools together manually.
How Do You Prevent Noisy or Inaccurate Data?
Governance is what keeps reporting accurate once you’re past ten or fifteen clients, since manual spot-checking stops scaling long before your client count does. Standardized audit frameworks and governance matter as much as the tooling itself.
Build these controls into your operation:
- Maintain a property audit log that records when each connection was verified and by whom.
- Run monthly sample reconciliation on a rotating subset of accounts rather than trying to check everything every cycle.
- Set anomaly detection thresholds so a 40% traffic swing triggers a review instead of quietly appearing in next month’s report.
- Keep ownership mapping current so departing team members don’t leave dead access credentials behind.
The most common failure modes repeat themselves: the wrong property connected, a locale or device mix that skews rankings, mismatched date ranges between tools, or attribution differences between GA4 and a rank tracker. Serpview’s custom annotations feature helps here, letting your team flag known site changes directly on the timeline so anomalies get context instead of triggering false alarms.
Pro Tip: Keep a living issue library with templated fixes for each recurring failure mode. When a strategist spots “wrong property connected” for the fifth time, they shouldn’t have to re-diagnose it from scratch.
What ROI Can You Expect From Automating Reports?
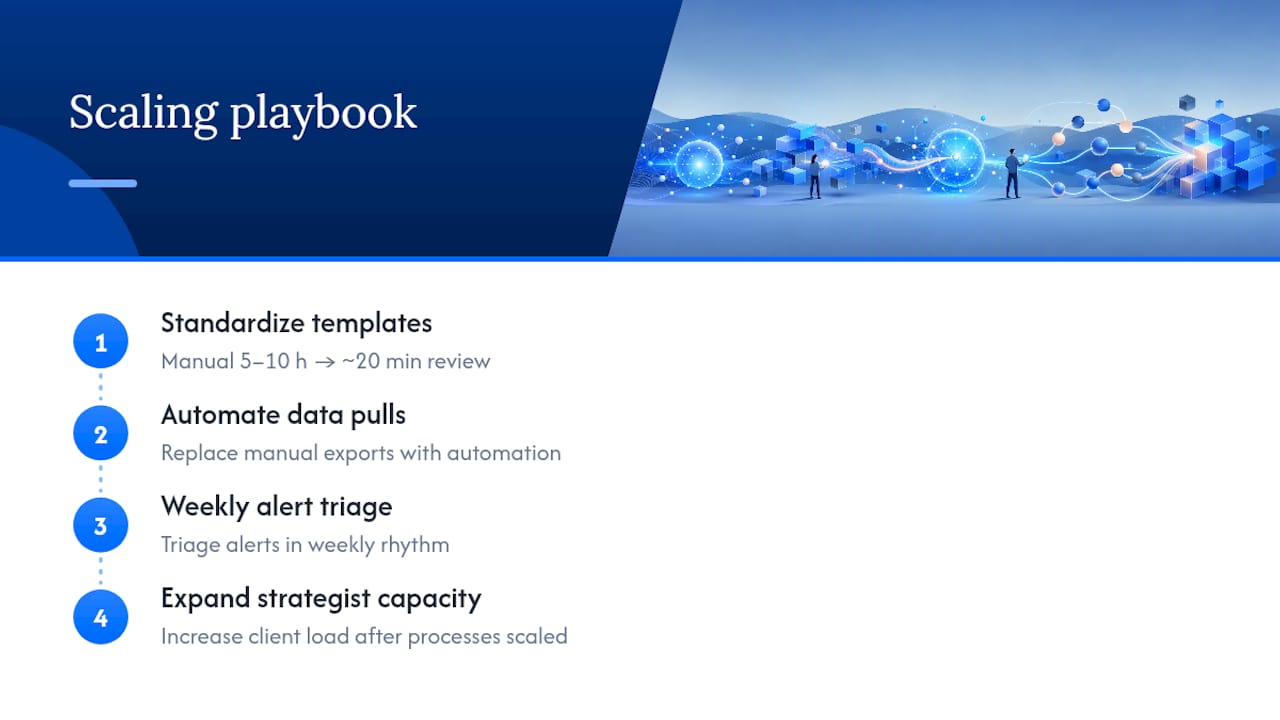
Manual reporting eats 5 to 10 hours per client per month, and that number scales linearly with your account list until something breaks. Automation can cut that same task down to roughly 20 minutes of review time per client, which changes the math on how many accounts a single strategist can realistically manage.
That gap isn’t just a time-savings story. Freed hours convert directly into more strategy time, faster turnaround on client questions, and higher retention because reports go out consistently instead of slipping when someone’s overloaded.
A simple scaling playbook follows from this: standardize your templates first, automate the data pulls second, build alert triage into your weekly rhythm third, and only then expand the number of clients each strategist owns. Trying to scale headcount before you scale process just multiplies the manual hours instead of reducing them.
How Do You Deliver Client-Facing Reports Professionally?
Clients rarely care how the data got assembled. They care that the report looks like it came from you, arrives on schedule, and answers the two or three questions they actually have. Scheduling and white-label delivery aren’t nice extras. They’re practical necessities for any agency running more than a handful of accounts.
Three delivery formats cover most agency needs:
Branded PDFs remain the standard for monthly client reports. They’re easy to archive, easy to forward internally on the client’s side, and they reinforce your agency’s identity every time someone opens one. Build the branding once into your template and let the automation handle the rest.
Client portals work well for accounts that want self-serve access between formal reports, particularly larger clients with their own marketing teams who want to check numbers without waiting for your monthly email. A live, shareable view, like Serpview’s shared dashboard feature, lets you grant that access without exposing your entire internal workspace.
Executive summaries deserve more attention than most agencies give them. Three to five sentences, written in plain language, sitting at the very top of the report. That’s the only part many stakeholders read, so it needs to answer “is this working” without requiring them to interpret a chart. If your commentary bank is doing its job, this section should take a strategist two or three minutes to personalize, not twenty.
What Privacy and Compliance Issues Come With Multi-Property Data?
Managing dozens of client properties means handling analytics data that legally belongs to each client, not to your agency. That distinction matters more as portfolios grow.
Keep access scoped tightly. Each team member should have permissions matching their actual role, not blanket admin access across every account “for convenience.” When a client offboards, revoke access immediately rather than letting old credentials linger, since stale permissions are both a security risk and a common source of the wrong-property errors that corrupt reporting.
Be explicit with clients about what data your reporting stack stores, for how long, and who on your team can see it. Many clients operate under their own compliance obligations, particularly in regulated industries like healthcare or finance, and they will ask. Having a clear answer ready, rather than improvising one, protects the relationship. If you’re consolidating data across properties in a shared platform, confirm that platform’s own data handling practices align with what you’ve promised your clients, and keep that documentation on hand rather than assuming it will never come up.
Should You Customize Templates by Client Type?
A single rigid template flattens the real differences between an ecommerce client tracking revenue per category and a local service business tracking calls and form fills. The core structure, executive summary, movers, traffic, technical health, backlinks, and next actions, stays constant. What changes is which metrics get emphasis.
For ecommerce clients, weight the traffic and conversion section toward revenue per category and product-level ranking distribution rather than blended site-wide sessions. For local service businesses, calls, form submissions, and local pack visibility often matter more than raw organic traffic. For SaaS or B2B clients, pipeline-influenced metrics and content-cluster performance tend to carry more weight than short-term ranking swings.
Build these as template variants, not one-off custom reports. Three or four industry-specific versions of your core template give you the flexibility clients need without forcing your team to reinvent formatting every month. This is also where keyword-level analysis becomes genuinely industry-specific: a keyword’s commercial intent looks very different for a mattress retailer than for a B2B software vendor, even when the ranking movement looks identical on a chart.
How Do You Add Competitive Context to Portfolio Reports?
A ranking chart that only shows a client’s own performance misses half the story. Competitive movement explains a lot of what clients ask about: “why did our position-3 keyword drop” often has more to do with a competitor’s new page than anything on the client’s own site.
Add a lightweight competitive layer to each report rather than a full separate competitive audit every month. Track how the top three to five competitors are trending on the client’s priority keyword set, and flag any competitor content that newly outranks the client on a term that matters. Understanding relative keyword difficulty shifts over time also helps explain why a keyword that used to be winnable suddenly isn’t, which is a much more useful client conversation than a bare ranking drop with no context.
Keep this section short. One paragraph and a small comparison table beats a dense competitive deep dive that buries the client’s own performance data.
How Do You Handle Data Anomalies and Inconsistencies?
Every portfolio eventually produces a report where the numbers just don’t look right, a traffic spike with no clear cause, a ranking swing that doesn’t match the rank tracker, a conversion count that disagrees with the client’s own CRM. The instinct to publish anyway and explain later is the wrong one.
Start troubleshooting with the boring explanations first. Check whether the date range matches across every tool pulling data into the report. Confirm the property connected is still the canonical one, since reconnecting the wrong domain after a client migration is one of the most common causes of a sudden, unexplained data jump. Check for a tracking code that broke during a recent site update.
If the anomaly holds up after those checks, it’s real, and it deserves a sentence in the executive summary rather than a footnote. Clients trust agencies more when a report says “traffic dropped 18% following a site migration on March 3, and here’s what we’re doing” than when a chart quietly looks worse with no explanation attached. Log every resolved anomaly in your issue library so the next strategist who sees the same pattern doesn’t have to re-diagnose it from zero.
How Do You Train Your Team on Portfolio Reporting?
Reporting quality degrades fastest when a new strategist inherits a portfolio without understanding why each template section exists. Training needs to cover the reasoning behind the framework, not just which buttons to click.
Start new team members on the validation checklist before they touch a live client report. Have them run the reconciliation steps, matching GSC data to exports, sampling URLs manually, on a test account so mistakes surface in a low-stakes setting. Pair this with direct access to the issue library so they inherit the accumulated knowledge of every anomaly the team has already solved, rather than rediscovering the same wrong-property error six months later.
Rotate new hires through a few different client industries early on, since the template customization patterns above only make sense once someone has seen how differently an ecommerce report and a local service report actually read. Review their first two or three client reports line by line before they go out, focusing feedback on the executive summary and the prioritized action item, since those are the two elements clients actually read closely.
Author Perspective: Trade-Offs and Why Human Review Still Matters
Automation should absorb the pulls, the formatting, and the scheduling. It should not absorb the judgment call about which anomaly deserves a sentence in the executive summary or which client relationship needs a phone call instead of a PDF. Customize a report when a genuine strategic shift happened. Otherwise, trust the template. Centralize commentary and the issue library in one place, because the moment either lives in someone’s head instead of a shared system, quality becomes dependent on who’s covering that account this month.
— Utsav Chopra
How Serpview Fits This Playbook
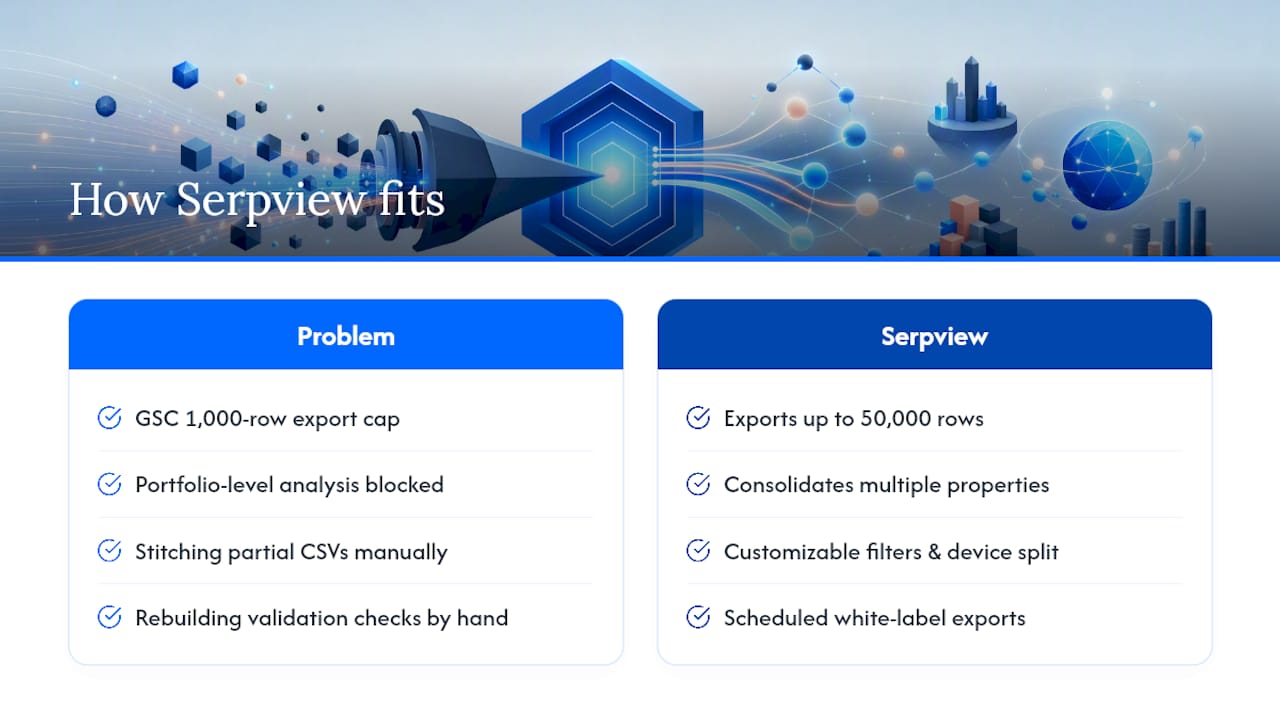
Every requirement in this guide, canonical domain checks, standardized KPIs, scheduled white-label delivery, a human review layer, maps directly onto what a consolidation platform needs to do well. Serpview was built to solve the specific constraint that pushes most agencies toward manual workarounds: Google Search Console’s 1,000-row export cap, which makes portfolio-level keyword and page analysis nearly impossible once you’re managing more than a few sites.
Serpview consolidates data across multiple properties into one dashboard, with exports up to 50,000 rows so you’re not stitching together partial CSVs from ten different GSC accounts. Customizable filters and mobile versus desktop segmentation support the device splits your onboarding checklist calls for, and scheduled, white-labeled exports handle the client-facing delivery side without a separate report-building tool bolted on. The shared dashboard feature also covers the client-portal use case, giving accounts self-serve visibility between your formal monthly reports.
If you’re currently rebuilding the same validation checks by hand across a growing client list, start by mapping your current stack against the onboarding steps in this guide, then see where a consolidated dashboard closes the gaps. Feature pages of consolidation platforms walk through the specifics, and a trial account is the fastest way to see whether a platform fits your current reporting workflow before you commit to migrating your whole portfolio.
Further Reading and Implementation References
For deeper detail on the concepts above, see Serpview’s guides on structuring client-ready SEO reports, enterprise-scale reporting with large exports, and automating dashboard setup within a 4-week window. For measurement principles outside the Serpview ecosystem, this piece on monitoring SEO performance covers KPI selection in more depth.
Sources
At minimum: Google Search Console on the canonical property, GA4 with confirmed attribution settings, a rank tracker with locale and device splits, a crawl tool, and a backlink data source.
- How SEO Agencies Use Automation to Manage 50+ Client Accounts
- Technical SEO audit mistakes and how to prevent them
- How Agencies Manage Multi Site SEO
FAQ
What Is Portfolio SEO Reporting?
It’s the practice of consolidating SEO data, rankings, traffic, technical health, and backlinks, across multiple client or brand properties into standardized, comparable reports rather than treating each site as a one-off analysis.
How Many Hours Does Manual Portfolio Reporting Typically Take?
Manual reporting runs 5 to 10 hours per client per month for most agencies, a figure that scales linearly with account count until automation is introduced.
How Long Does It Take to Automate a Reporting Workflow?
Most agencies need 4 to 8 weeks to map workflows, connect data sources, and run parallel manual and automated reports before fully cutting over.
Can a Tool Like Serpview Replace Manual Portfolio Reporting Entirely?
Serpview automates the data consolidation and export side, pulling up to 50,000 rows across properties, but the strategist commentary and anomaly review layer described throughout this guide should stay in human hands.
What’s the Biggest Mistake Agencies Make When Scaling Reporting?
Connecting the wrong property, a staging domain, an HTTP variant, or the wrong subdomain, is the most frequent technical error agencies make when onboarding new accounts into a reporting system.
Recommended
Ready to unlock your full GSC potential?
SERPView helps you access all your Google Search Console data without limitations. Start your free trial today.
Get Started Free