
SEO Reporting Cadence for Teams: Automate Data, Humanize Analysis
SERPView Team
SEO Analytics
Use a three-tier reporting rhythm: weekly operational checks, a monthly decision-focused report, and a quarterly strategic review. This layered seo reporting cadence catches technical problems early while giving stakeholders a trend window long enough to act on. The sections below break down what belongs at each interval, who needs to see it, and what to automate versus what still requires a human eye.
TL;DR:
- Most SEO programs need tight control of reporting cadence, with weekly checks for technical issues and monthly reports for performance trends to avoid missing critical problems.
- Different stakeholder groups require customized report formats: executives need brief summaries once a month, while operational teams need real-time dashboards and alerts.
- Using a consistent, automated reporting infrastructure helps maintain stability over time, reducing manual work and preventing misinterpretation of data.
- Rely on multiple comparison windows within monthly reports to avoid misleading conclusions caused by seasonal or short-term fluctuations.
- Tools like SERPView can streamline data collection and dashboard setup, ensuring accurate, scheduled reports that support decision-making without rebuilding workflows monthly.
Table of Contents
- What Is the Right SEO Reporting Cadence at Each Level?
- How Often Should You Report to Executives vs. Analysts?
- Which Metrics Belong in Each Report, and Which Should You Drop?
- What Should You Automate, and What Still Needs a Human?
- How Do You Set Up a Sustainable Reporting Schedule?
- What Belongs on the Quarterly Strategic Review Agenda?
- What Working Reporting Cadences Actually Have in Common
- Build the Cadence Without Rebuilding Your Workflow Every Month
- Sources
- FAQ
What Is the Right SEO Reporting Cadence at Each Level?
Most SEO programs fail at reporting not because the data is wrong, but because the timing is. A weekly report full of ranking noise trains stakeholders to ignore it. A quarterly-only report means a broken sitemap goes undetected for 90 days. The fix is matching the reporting interval to the decision it supports.
Here’s how the three tiers break down in practice.
Weekly operational checks exist to catch fires, not to tell a story. Keep this tier lean:
- Crawl errors and indexation drops flagged by automated alerts
- Uptime and site availability status
- Major ranking losses on money pages (not incremental fluctuation)
- Critical conversion tracking regressions
- A short internal status note, not a formatted deck
This tier should take five minutes to read and rarely more than fifteen minutes to produce, because most of it runs on automated thresholds rather than manual pulls.
Monthly performance reports are where the real decision-making happens. This is the seo report frequency most industry guidance treats as the default, because a month gives you enough data to separate a real trend from statistical noise. A solid monthly report includes:
- A headline narrative that states what happened and why, in three or four sentences
- Top movers, both pages that gained and pages that lost visibility
- Revenue or lead attribution tied to organic traffic
- Three to five prioritized technical or content actions
- An owner and a due date attached to each action
Quarterly strategic reviews step back from the month-to-month grind to ask bigger questions: Is the content strategy still working? Does the budget need to shift? What experiments paid off, and which ones should get killed? This tier covers topic-level health, resource allocation, and forecast adjustments rather than individual page performance.
A few situations justify breaking from this default rhythm. Sites with high publishing velocity, active migrations, algorithm volatility, and large ecommerce catalogs with constant inventory churn all benefit from tighter, more frequent checks, sometimes daily during a migration window. Once things stabilize, drop back to the standard three-tier rhythm. Cadence should flex with risk, not stay fixed out of habit.
How Often Should You Report to Executives vs. Analysts?
A single report format sent to everyone is one of the fastest ways to lose an executive’s attention and starve an analyst of the detail they actually need. Different stakeholders make different decisions, so their analytics reporting schedule should look different too.
Executives need a one-page monthly summary built around pipeline and revenue signals, nothing more. Save the keyword-level detail for someone else. Once a quarter, that summary graduates into an actual conversation, where you’re asking for budget, headcount, or a strategic pivot rather than just reporting status.
Strategic leads, the people who own the SEO roadmap, need the monthly deep dive: keyword and topic cluster movement, experiment results, and conversion trend analysis. This audience benefits most from a live dashboard paired with a monthly deck that walks through what the numbers mean, not just what they are.
Operational teams, the writers, developers, and technical SEOs doing the daily work, need weekly pulses and always-on dashboards. They’re not waiting for a monthly report to find out a page dropped out of the index. They need that signal now, tied directly to the queue of work they’re already managing.
The distribution list is where most reporting rhythms break down. Build it by decision ownership, not by job title or seniority:
- Include only the people who will act on what the report says
- Route highly technical detail to implementers, not to executives who will skim past it anyway
- Keep an “archive” recipient group for anyone who wants visibility without needing to be in the primary loop
Over-mailing non-decision stakeholders trains everyone to skim, and skimmed reports don’t drive action.
Which Metrics Belong in Each Report, and Which Should You Drop?
Every cadence tier needs its own core metric set, and mixing them up is one of the most common mistakes in seo metrics reporting. Weekly reports should track only the handful of numbers that flag something broken; monthly reports carry the fuller picture.
The core KPIs worth tracking on a recurring basis:
- Search visibility and indexed page count
- Organic sessions, split between branded and non-branded queries
- Click-through rate by page or query cluster
- Organic conversions and attributed revenue
- Crawl and index health status
- Top-performing pages by traffic and conversion contribution
Just as important is what to leave out. Raw domain authority scores from third-party tools tell you almost nothing about revenue impact. Unfocused keyword-count totals inflate a report without adding insight. Impression counts without click or conversion context lack meaningful progress information.
Statistically speaking, month over month reporting alone can mislead you. A reliable monthly template mixes multiple comparison windows: the current month against the prior month, a trailing three-month average to smooth out noise, and a year-over-year comparison whenever the business has seasonal traffic patterns. Relying on a single window makes a normal dip look like a crisis, or a seasonal lull look like decline.
A repeatable monthly template needs five parts: the headline narrative, top five movers, a revenue and attribution bridge, a technical health snapshot, and a prioritized action list with owners and due dates. Keep raw data in an appendix rather than the main body. Presenting the narrative before the numbers helps stakeholders reach the right conclusion before they get lost in a spreadsheet.
What Should You Automate, and What Still Needs a Human?
The line between automation and analysis is where most reporting programs either save hours or waste them. Automating recurring data pulls and scheduled exports cuts manual reporting time significantly, but the interpretation, the narrative, and the root-cause digging still need a person behind the keyboard.
What belongs on autopilot:
- Recurring data collection from Search Console and analytics platforms
- Scheduled exports on a fixed calendar
- Threshold-based anomaly alerts for uptime, indexation, and revenue drops
- Recurring table and chart updates feeding the live dashboard
Pro Tip: Keep automated alerts binary. An alert should read “OK” or “ALERT,” nothing more. The moment an automated system tries to explain why something happened, it starts guessing, and guessing is a job for a human analyst, not a script.
Dashboard practice matters as much as the automation itself. Keep one shared live dashboard for the people doing the day-to-day work, and generate scheduled snapshot exports for executives who want a fixed point in time rather than a moving target. Lock the metric definitions and filters across every report; changing them month to month makes trend lines meaningless.
This is where a tool like SERPView earns its place in the stack. It consolidates Search Console data across properties past the standard 1,000 row limit, exporting up to 50,000 rows for deeper keyword and page-level analysis. Shared dashboards and scheduled reports map directly onto the weekly, monthly, and quarterly rhythm described above, without someone manually re-pulling data every Monday morning.
One scheduling detail worth building into the calendar: set automated exports to run a few days after the period closes rather than on day one. Late-processed hits can trickle in for 48 to 72 hours, so a report pulled on the 4th of the month captures a more complete picture than one pulled at midnight on the 1st.
How Do You Set Up a Sustainable Reporting Schedule?
A cadence only works if it survives contact with real calendars. Timing, distribution, and follow-through all need rules, or the schedule quietly erodes within a quarter.
Timing rules:
- Send reports Tuesday through Thursday, mid-morning, when stakeholders are most likely to actually read them
- Avoid Monday sends, when inboxes are backed up, and Friday sends, when nobody’s reading anything closely
- For monthly reports, use the 4th-of-month rule to capture late-processed data rather than an incomplete snapshot
Distribution and preparation checklist:
- Keep executives on the one-page summary only, not the full appendix
- Route the full report to decision owners and the implementers doing the work
- Maintain an archive list for anyone who wants visibility without adding to the primary send
Before anything goes out, run through the same short checklist every time: validate the underlying data, draft the narrative first, build the action list with named owners and due dates, and attach the raw export as an appendix. A quick sanity check against last month’s numbers catches tracking errors before a stakeholder does.
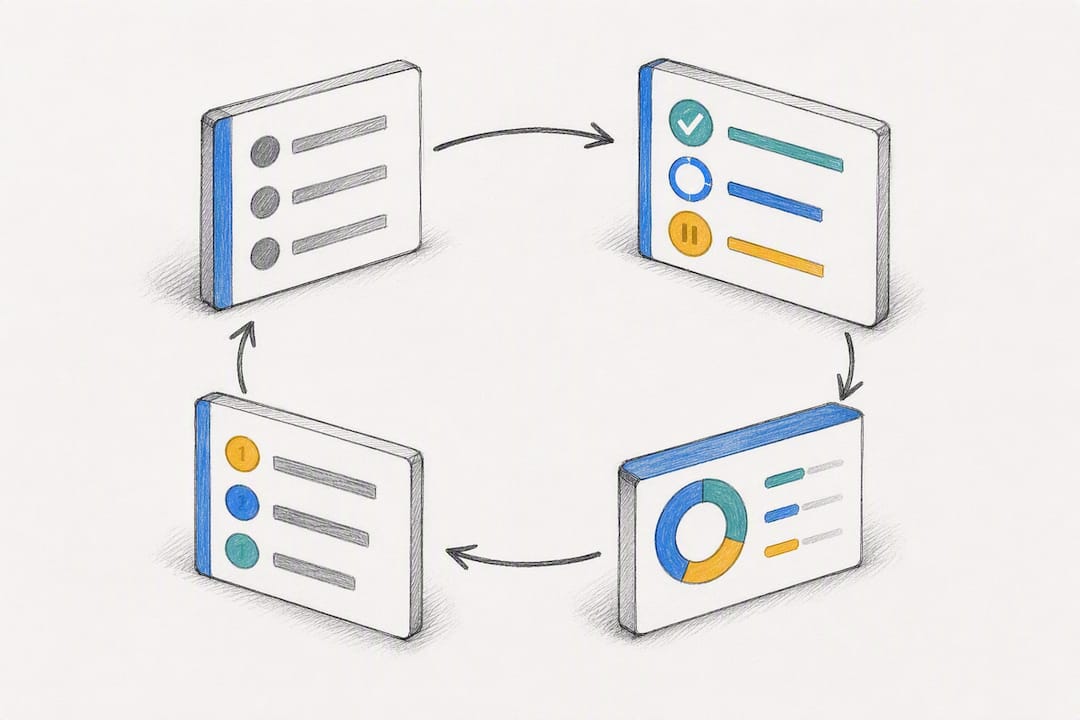
The step most reports skip is the closed loop. Open each new report by revisiting the action items from the previous one and stating plainly what happened: done, in progress, or dropped. A simple completion scorecard, tracked month over month, does more to build stakeholder trust than any chart in the report. It shows the reporting interval for seo isn’t just a status update ritual. It’s a mechanism that produces follow-through.
What Belongs on the Quarterly Strategic Review Agenda?
The quarterly review is where a team steps out of the weekly and monthly grind to ask whether the strategy itself still holds up. This isn’t a longer version of the monthly report. It’s a different kind of conversation, built around resource decisions rather than performance updates.
A working quarterly agenda covers:
- A strategic narrative summarizing the last 90 days and where the program is heading
- Topic cluster health across the site’s core content pillars
- Outcomes from any experiments run during the quarter, including the ones that failed
- Competitive shifts in SERP positioning worth reacting to
- Resource and budget requests tied to specific initiatives
The expected output isn’t a report; it’s a decision. Teams should leave with a reprioritized roadmap, adjusted forecasts, a short list of approved experiments for the next quarter, and named owners for each strategic initiative.
Invite cross-functional stakeholders who don’t attend the monthly cadence — product, content strategy, sometimes finance — and send a one-page brief ahead of time so the meeting starts with context instead of a data dump.
What Working Reporting Cadences Actually Have in Common
The programs that sustain a healthy reporting cadence for years, not just a quarter, tend to share a few habits. They lock the core template early and resist the urge to redesign it every time someone asks for a new chart. Stable metric definitions are what let a stakeholder glance at month six and understand it in the context of month one.
They also lead with narrative, every time. A report that opens with numbers forces the reader to build their own conclusion, and readers under time pressure build the wrong one.
The teams that struggle most usually made one of two mistakes: they automated the narrative along with the data pull, producing reports that are technically accurate and completely lifeless, or they never automated anything, burning hours each month on manual exports that add zero analytical value. The fix in both cases is the same. Let automation own the data plumbing. Keep the interpretation, the “so what,” firmly in human hands.
— Utsav Chopra
Build the Cadence Without Rebuilding Your Workflow Every Month
SERPView exists for the exact problem this cadence creates: pulling clean, complete data on a recurring schedule without hitting the wall Search Console puts in front of most exports.

Google Search Console caps most exports at 1,000 rows, which is fine for a quick check and useless for a real monthly report on a site with any meaningful keyword footprint. SERPView pulls up to 50,000 rows across properties, so the weekly alert and the monthly deep dive can both run off the same consolidated dataset instead of a patchwork of manual exports. A team running the three-tier cadence described above can set up one shared dashboard for the operational weekly pulse, schedule the monthly export to land automatically, and pull the quarterly view straight from historical data already sitting in the platform. If you’re still stitching together spreadsheets to hit your reporting interval for SEO, start by looking at what a shared dashboard and scheduled exports can take off your plate.
Sources
FAQ
What is the 80/20 rule in SEO?
The 80/20 rule suggests roughly 80% of organic results come from 20% of your efforts, usually your highest-performing pages, keyword clusters, or technical fixes. In reporting terms, it means your monthly report should spend most of its attention on the small set of pages and issues actually driving traffic and revenue, not on every metric that moved.
What is cadence in marketing?
Cadence refers to the fixed rhythm at which a team communicates results, whether that’s email sends, campaign check-ins, or SEO reports. In SEO specifically, a well-set cadence means weekly operational checks, monthly performance reports, and quarterly strategic reviews, each timed to match the decision it needs to support.
What are the 3 C’s of SEO?
Definitions vary depending on the source, but a commonly cited version refers to content, code, and credibility, meaning what you publish, how technically sound the site is, and how much authority it has earned. These three areas map closely to what shows up across the weekly, monthly, and quarterly reporting tiers.
What is the best tool for SEO reporting?
The best tool depends on scale: teams managing a single small site can often work within Search Console’s native limits, but anyone managing multiple properties or needing deeper keyword and page-level detail benefits from a platform like SERPView, which consolidates data beyond the standard 1,000 row export cap.
How often should you report on SEO performance?
Most programs should run weekly operational checks, a monthly stakeholder report, and a quarterly strategic review, adjusting only for high-publishing velocity, active migrations, or algorithm volatility that requires closer monitoring.
Recommended
Ready to unlock your full GSC potential?
SERPView helps you access all your Google Search Console data without limitations. Start your free trial today.
Get Started Free