
Keyword Opportunity Reporting: Your SEO Growth Playbook
SERPView Team
SEO Analytics

TL;DR:
- Keyword opportunity reporting transforms raw search data into a prioritized, revenue-focused list of actionable opportunities.
- It emphasizes fixing high-impaction pages, mapping queries to funnel stages, and scoring opportunities by revenue relevance rather than volume.
- Using enriched signals and a systematic build process helps teams identify quick wins and long-term growth opportunities efficiently.
Keyword opportunity reporting converts raw search data into a prioritized, revenue-aligned action list your team can execute this week. Once you open your next report, three moves will generate faster wins than any raw keyword export ever could:
- Fix low-CTR, high-impression pages first. These pages already have Google’s attention — a metadata rewrite can lift clicks without touching rankings.
- Map every candidate query to a funnel stage. Intent alignment tells you whether to optimize for conversion or expand content, which determines who owns the work and what success looks like.
- Score opportunities by revenue relevance, not just search volume. A 200-impression query with a $400 average order value often outranks a 10,000-impression query with zero conversion history.
Each of these actions works because it connects a search signal directly to a business outcome, skipping the intermediate step of debating whether a keyword is “worth targeting.”
Table of Contents
- What is a keyword opportunity report?
- Why keyword opportunity reporting matters for your business
- What opportunity types should you look for?
- How to segment keywords for funnel-driven reporting
- Key metrics your opportunity report must include
- Which tools and data sources build a reliable report?
- How to build the keyword opportunity report step by step
- How to prioritize opportunities with a scoring model
- How to present findings to stakeholders
- Mini case: finding one opportunity in Search Console
- Key Takeaways
- What experienced SEOs actually do with opportunity reports
- Serpview makes the data work you just read about faster
- Useful sources, templates, and quick downloads
- FAQ
What is a keyword opportunity report?
A keyword opportunity report is a diagnostic, prioritized document that identifies search queries where your site has a realistic path to profitable organic visibility. It is not a keyword export. A raw keyword list from Ahrefs or SEMrush is an input — a spreadsheet of possibilities with no context about your site’s current position, your audience’s intent, or the revenue attached to a conversion.
The report transforms those inputs by layering in multiple signals: demand, intent fit, SERP weakness, existing site traction, and revenue relevance. The result is a ranked candidate list where every row has a recommended action, an estimated impact, and a clear owner.

Common signals used to build the report include impressions and clicks from Google Search Console, average position, CTR against expected benchmarks for that position, conversion data from GA4, and keyword difficulty from tools like Ahrefs or SEMrush. Together, these signals answer the question that a raw list cannot: which of these queries should we work on first, and why?
Why keyword opportunity reporting matters for your business
The core value of this reporting is speed to prioritized work. Without it, SEO teams spend cycles debating which keywords to target rather than executing on the ones most likely to move revenue.
The business outcomes are concrete. Identifying page-2 queries and pushing them to page 1 drives incremental organic sessions without new content investment. Fixing low-CTR pages improves click volume from existing rankings. Aligning content to commercial intent increases the share of organic sessions that convert. Over a quarter, these compounding gains show up in SEO-driven revenue and a more defensible content roadmap.
Use cases vary by cadence. For paid search, a weekly search-terms check surfaces misaligned intent and wasted spend before it accumulates. For organic, a monthly or quarterly opportunity sweep is the right rhythm for most teams — frequent enough to catch emerging queries, infrequent enough to let content changes settle before re-evaluation. Executive prioritization and budget forecasting work best on a quarterly cadence, when you can show projected traffic and revenue uplift alongside the work required.
For teams optimizing local visibility, local discovery signals — geographic modifiers, near-me queries, and business-category terms — all belong in the report alongside national keywords.
What opportunity types should you look for?
Four archetypes reliably translate into prioritizable work:
- Sleeping giants. These are queries where your pages rank on page 2–3 with meaningful impressions. The page already has some authority — a focused rewrite and two or three internal links from higher-authority pages often push it to page 1 within weeks.
- High impressions + low CTR. Your page ranks, but searchers aren’t clicking. The cause is usually a SERP feature (featured snippet, AI overview, or People Also Ask box) stealing clicks, or a title and meta description that don’t match the query’s intent. Fix the metadata first; if a SERP feature is the culprit, AI overviews and SERP features reduce organic CTR for many queries, so factor realistic click potential into your uplift estimate.
- High impressions + low position (positions 11–30). These queries have demand but your content hasn’t earned a top-10 slot. The fix is usually content expansion, structured data, or link building — higher effort, but the ceiling is higher too. Use impressions as a proxy for demand when third-party volume data is thin.
- Low-competition long-tail keywords and weak-spot SERPs. When the top-ranking results are thin, low-authority pages, a well-structured piece can rank quickly. Filter for queries where the current top results have low domain authority or thin word counts.
- Trending queries. Seasonal or emergent topics can spike fast. Monitor these on a two-week lag before committing content resources — a query that trends for one week rarely justifies a full content investment, but one with three consecutive weeks of impression growth usually does.
How to segment keywords for funnel-driven reporting
Segmentation is what turns a list of opportunities into a content roadmap with clear owners. The four dimensions that matter most are: branded vs. non-branded, informational vs. commercial intent, funnel stage, and page template.
A user-focused keyword analysis improves content prioritization by aligning your language with how users naturally search — which means segment labels should reflect the searcher’s job-to-be-done, not your internal taxonomy.
| Query example | Segment | Recommended action | Owner |
|---|---|---|---|
| “how to write a meta description” | Informational / awareness | Content expansion, add FAQ schema | Content team |
| “best SEO reporting tools” | Informational / consideration | Comparison content, internal linking | Content + SEO |
| “buy SEO dashboard software” | Commercial / purchase | Conversion rate optimization, landing page test | SEO + Product |
| “[Brand] pricing” | Branded / consideration | Protect ranking, update page with current pricing | Product marketing |
| “SEO reporting tool for agencies” | Commercial / consideration | New landing page or segment-specific content | Content + SEO |
Map each segment to a recommended action before the report goes to stakeholders. That mapping is what prevents the report from becoming a reading exercise.
Key metrics your opportunity report must include
Every column in the report should earn its place by enabling a decision. Here are the minimum required fields and the secondary fields worth adding when you have the data:
Essential columns:
- Query, page URL, page type, and segment/intent tag
- Impressions, clicks, CTR, and average position (from Google Search Console)
- Impressions trend (week-over-week or month-over-month delta)
- Conversions and goal value (from GA4, joined by landing page)
- Revenue per conversion or average order value (from GA4 e-commerce or CRM)
Secondary fields:
- SERP features present (featured snippet, AI overview, PAA, local pack)
- Estimated CTR for target position (from a standard CTR curve)
- Ranking gap: target position minus current position
- Keyword difficulty as a filter, not a decision-maker
Uplift estimation formula:
Estimated incremental visits = Impressions × (CTR at target position − current CTR) Estimated revenue uplift = Incremental visits × site conversion rate × average order value
This formula gives you a revenue-denominated reason to prioritize one opportunity over another. Use it as a directional estimate, not a guarantee — CTR curves vary by query type and SERP layout.
Which tools and data sources build a reliable report?
Each data source supplies specific columns. Knowing which source owns which field prevents the most common joining errors.

Google Search Console supplies impressions, clicks, CTR, and average position at the query and page level. The default UI caps exports at 1,000 rows, which means you’re likely missing the long tail entirely. A unified export or API pull removes that ceiling — Serpview, for example, surfaces up to 50,000 rows and consolidates data across multiple properties in one dashboard.
GA4 supplies conversions, session behavior, and goal value by landing page. Join GA4 to GSC using the landing page URL as the key, within a consistent date window. Watch for close-variant query aggregation in GSC — a single landing page may map to dozens of query variants, so aggregate at the page level before joining.
Rank trackers (Ahrefs, SEMrush) supply SERP snapshots, keyword difficulty, and competitor position data. Use these to validate GSC position data and to identify SERP features that may suppress CTR.
Internal CRM or e-commerce data supplies average order value and revenue per conversion. This is the layer most teams skip, and it’s the one that makes the difference between a traffic report and a revenue forecast.
A ranking-queries export that links query signals directly to landing-page behavior speeds up the join step considerably and reduces the risk of misattributing a query to the wrong page.
Pro Tip: The search terms report in Google Ads reveals what users actually typed — not just the keyword that triggered the ad. Run a minimum two-week audit of this report for active paid accounts to surface high-intent queries that belong in your organic opportunity pipeline.
How to build the keyword opportunity report step by step
Follow this workflow to produce a report your team can act on within one reporting cycle:
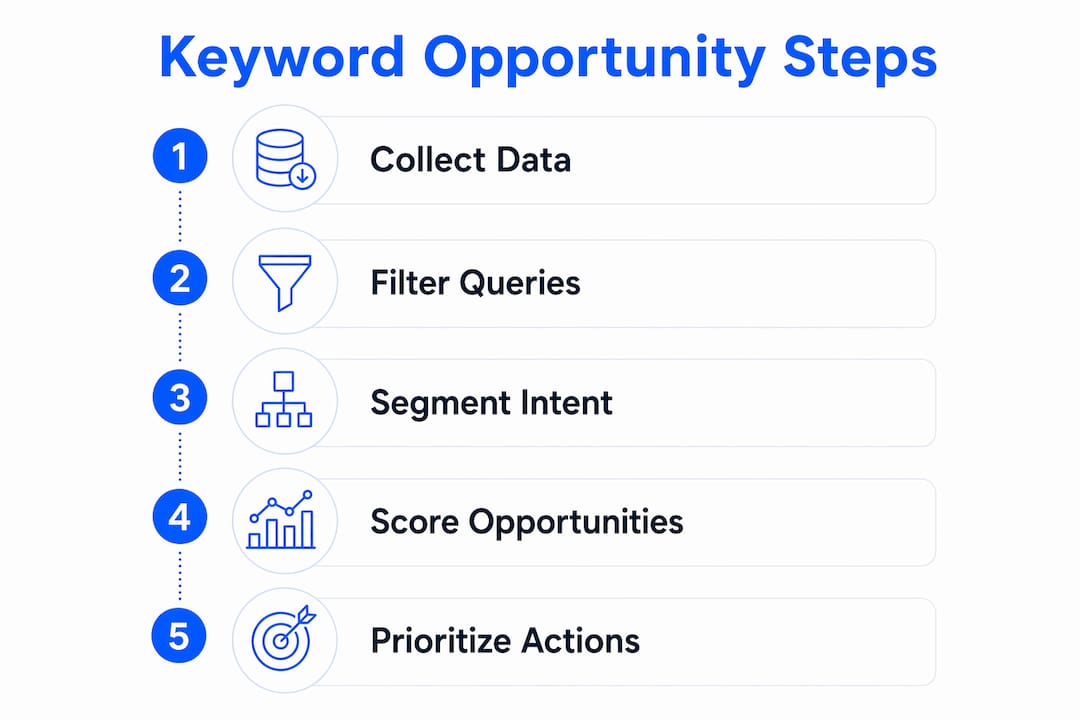
- Export GSC Performance data at the query level: impressions, clicks, CTR, and average position. Use a 90-day window for organic opportunity sweeps; 28 days for high-change environments. Pull via API or a tool that bypasses the 1,000-row UI limit.
- Export GA4 conversions by landing page for the same date window. Include goal value or revenue where available.
- Map queries to landing pages. Use the page URL as the join key. In GSC, filter by page to see which queries drive traffic to each URL.
- Enrich with volume and difficulty from Ahrefs or SEMrush. Add estimated monthly search volume and a difficulty score as reference columns.
- Tag intent and segment each query using the framework above (branded/non-branded, informational/commercial, funnel stage, page type).
- Calculate score fields: ranking gap, estimated CTR uplift, estimated incremental visits, and estimated revenue uplift using the formula in the metrics section.
Template CSV column set:
| Column | Source |
|---|---|
| query | GSC |
| page_url | GSC |
| impressions | GSC |
| clicks | GSC |
| ctr | GSC |
| avg_position | GSC |
| impressions_trend | GSC (delta) |
| conversions | GA4 |
| revenue | GA4 / CRM |
| intent | Manual tag |
| segment | Manual tag |
| opportunity_score | Calculated |
Initial filtering thresholds (adjust to your site’s scale): impressions > 500 over 90 days, average position between 4 and 20, CTR below the expected benchmark for that position. This range captures both quick wins (positions 4–10) and content-expansion candidates (positions 11–20) while excluding queries with too little data to act on.
How to prioritize opportunities with a scoring model
Generic tool scores are a useful starting point, but they don’t know your conversion rate, your average order value, or how much effort a content update actually takes on your site. Custom-weighted scoring layered with revenue forecasting is what separates a prioritized backlog from a ranked list of guesses.
A practical scoring model combines five factors, sometimes called DICER:
| Factor | What it measures | Example weight |
|---|---|---|
| Demand | Monthly impressions or search volume | 20% |
| Intent fit | How well the query matches your offer | — |
| Current traction | Existing position and click history | 15% |
| Effort to win | Content update, links needed, technical fix | 20% |
| Revenue relevance | AOV × conversion rate for this segment | 20% |
Score each factor on a 1–5 scale, apply the weights, and sum to get a composite score. Sort descending. The top items become your sprint backlog; the rest go into a watch list.
Pro Tip: Before finalizing priorities, run the uplift formula from the metrics section on your top 10 candidates. A query scoring 3.8 with a $300 AOV segment will almost always outperform a query scoring 4.2 in a zero-conversion segment. Revenue relevance should break ties.
How to present findings to stakeholders
A good presentation answers three questions before anyone asks: what is the opportunity, what do we do about it, and who owns it?
Structure your findings around these elements:
- Headline opportunity: estimated monthly revenue uplift from the top five prioritized keywords, stated as a dollar range
- Quick wins vs. long-term bets: separate the sleeping giants and low-CTR fixes (weeks to impact) from the content-expansion and link-building candidates (months to impact)
- Required owners and effort: one row per opportunity, with the team or person responsible and a rough effort estimate (hours or story points)
- Measurement plan: which KPIs you’ll track, at what cadence, and what threshold signals success
Visuals that work in stakeholder reviews: a ranked opportunity table sorted by estimated revenue uplift, a small-sample CTR curve showing current vs. target position, a traffic/revenue uplift chart projecting the next 90 days, and a SERP screenshot for one example query showing the gap between your current result and the top-ranking page.
KPIs to track after execution: average position for targeted queries, CTR by segment, organic sessions to optimized pages, assisted conversions, and revenue per keyword segment. A shared live dashboard lets stakeholders check progress between reporting cycles without waiting for the next deck.
Mini case: finding one opportunity in Search Console
Here’s how the workflow plays out on a real-world example. Suppose you export 90 days of GSC data for a SaaS site and apply the initial filters: impressions > 500, position 8–15, CTR below 2%.
One query surfaces: “SEO reporting dashboard.” Here’s sample data illustrating typical metrics without specifying exact counts or values:
| Metric | Value |
|---|---|
| Query | SEO reporting dashboard |
| Impressions (90 days) | a moderate number of impressions |
| Clicks | a small number of clicks |
| CTR | a low click-through rate |
| Average position | a mid-range average position |
| Expected CTR at position 3 | a typical high CTR for top positions |
| Estimated incremental clicks | estimated additional clicks based on CTR gap |
| Site conversion rate (assumed) | an assumed conversion rate |
| Average order value | an estimated average order value |
| Estimated monthly revenue uplift | estimated potential revenue uplift |
Calculation: 4,200 impressions × (10.0% − 1.5%) = 357 incremental clicks per 90 days, or roughly 119/month. At a 2.5% conversion rate and $180 AOV, that’s approximately 3 new customers per month worth $540 in monthly recurring revenue — or $1,701 over a quarter.
Recommended action: Rewrite the page title and meta description to match the query’s commercial intent, add two internal links from high-authority blog posts, and expand the page’s H2 structure to address related sub-queries. Set a 60-day measurement window and track position, CTR, and assisted conversions weekly.
Key Takeaways
Keyword opportunity reporting works when you combine revenue-weighted scoring with GSC data, intent segmentation, and a repeatable build cadence — not when you sort by volume alone.
| Point | Details |
|---|---|
| Start with sleeping giants | Page-2 queries with existing impressions are the fastest path to ranking gains without new content. |
| Fix low-CTR pages first | High impressions with low CTR signals a metadata or SERP-feature problem, not a ranking problem. |
| Score by revenue relevance | Weight AOV and conversion rate in your scoring model so high-value segments rise to the top. |
| Use a repeatable build cadence | Monthly or quarterly organic sweeps keep the report current; weekly checks suit paid search. |
| Serpview removes the row limit | Serpview surfaces up to 50,000 GSC rows, enabling full-tail opportunity sweeps standard exports miss. |
What experienced SEOs actually do with opportunity reports
The practitioners who get the most out of keyword opportunity reporting treat the report as a diagnostic tool, not a final answer. Here’s what that looks like in practice:
Do:
- Validate every opportunity against Search Console before briefing content. Third-party volume estimates can be off by a wide margin for niche queries.
- Use search analytics filters to isolate device type, country, and date range before drawing conclusions. A position-8 ranking on mobile may be a position-3 ranking on desktop.
- Check for keyword cannibalization before creating new content. Two pages competing for the same query dilute authority and confuse the prioritization model.
- Convert a prioritized item into a ticket with a clear brief, an owner, and a measurement window before the meeting ends. Reports that don’t produce tickets produce nothing.
Don’t:
- Trust a single tool’s opportunity score without layering in your own business context. Opportunity scores vary across tools and often oversimplify the competitive picture.
- Ignore AI overview and SERP feature presence when estimating CTR. A position-1 ranking below an AI overview may deliver a fraction of the clicks a clean position-1 result would.
- Run the report once and consider it done. Queries trend, algorithms update, and competitor content shifts the SERP. A quarterly refresh is the minimum; monthly is better for active sites.
- Assign every opportunity to the content team by default. Metadata fixes belong to SEO, conversion optimization belongs to product, and link building belongs to whoever owns authority development. Misassigned work stalls.
The cadence question has a simple answer: whoever owns organic search should own the report, review it monthly with the content lead, and present a prioritized shortlist to leadership quarterly. That rhythm keeps the work moving without turning every meeting into a data review.
Serpview makes the data work you just read about faster
The workflow in this guide depends on one thing most teams don’t have: clean, complete GSC data at scale. The default Search Console UI caps exports at 1,000 rows, which means the long-tail queries where most sleeping giants live never make it into your spreadsheet.

Serpview addresses that gap directly. Its unified dashboard pulls up to 50,000 rows across multiple Search Console properties, applies customizable filters by device, country, date range, and page type, and maintains an extended performance history so you can track trends that a 16-month GSC window would cut off. The ranking-queries feature maps queries to landing pages in one view, which cuts the manual join step from the build workflow above. For teams running the monthly opportunity sweep described here, that alone saves hours per cycle.
If the row limit or the manual join step is slowing your reporting down, explore Serpview’s dashboard to see how it fits your current stack.
Useful sources, templates, and quick downloads
- Uncover Hidden Keyword Opportunities in Search Data — Serpview’s practical guide to finding sleeping giants in Search Console data.
- Common Search Data Blind Spots for SEO Pros — covers GSC row limits, hidden search terms, and sampling issues that affect report accuracy.
- Organic Search Insight Tools: Benefits for SEO Pros — explains the practical benefits of unified analytics for opportunity reporting workflows.
- The Role of Real-Time Search Data in SEO Strategy — covers cadence decisions and when real-time signals should change your reporting rhythm.
- Content Groups feature — groups queries and pages by topic, which maps directly to the segmentation framework in this guide.
- Google Ads Search Terms Report — Google’s official documentation on the search terms report and how to use it for intent analysis.
- AI & LLM Development trends — background on how AI overviews affect organic CTR and click potential by query type.
CSV template: The column set from the “How to build” section above (query, page_url, impressions, clicks, ctr, avg_position, impressions_trend, conversions, revenue, intent, segment, opportunity_score) is ready to paste into Google Sheets or Excel. Pull your GSC export into columns A–F, your GA4 export into columns G–H, and fill intent and segment manually or with a lookup table keyed to query modifiers.
FAQ
What is the main purpose of keyword opportunity reporting?
Keyword opportunity reporting identifies search queries where your site has a realistic path to profitable organic visibility, then ranks them by estimated business impact so your team works on the right things first.
What are the four types of keywords in SEO?
Keywords are typically grouped by intent: informational (research queries), navigational (brand or site-specific queries), commercial (comparison and consideration queries), and transactional (purchase-ready queries). Each type maps to a different funnel stage and a different recommended action in your opportunity report.
What are the four stages of SEO?
The four stages are technical foundation (crawlability, indexation, site speed), on-page optimization (content, metadata, structured data), authority building (links, brand signals), and performance analysis (tracking rankings, traffic, and conversions). Keyword opportunity reporting drives the analysis stage and feeds back into the first three.
How do you prioritize keyword opportunities without over-relying on tool scores?
Build a custom-weighted scoring model that combines demand, intent fit, current traction, effort to win, and revenue relevance, then run the uplift formula (impressions × CTR delta × conversion rate × AOV) on your top candidates. Opportunity scores vary across tools and often oversimplify competitive dynamics, so your own business data should always have the final say.
How does Serpview help with keyword opportunity reporting?
Serpview removes the 1,000-row GSC export limit by surfacing up to 50,000 rows, consolidates data across multiple Search Console properties, and maps queries to landing pages through its ranking-queries feature, which cuts the manual join step from the build workflow.
Recommended
Ready to unlock your full GSC potential?
SERPView helps you access all your Google Search Console data without limitations. Start your free trial today.
Get Started Free