
Why Agencies Track Keyword Share of Voice
SERPView Team
SEO Analytics

Agencies track keyword share of voice (SOV) because it shows exactly how much of the buyer-relevant search conversation a client owns versus the competitive set — and that visibility predicts shortlist inclusion, pipeline influence, and ultimately revenue. A client ranking for a significantly larger portion of buyer-intent queries in their category is far more likely to appear on a prospect’s shortlist than one with less coverage. SOV turns that intuition into a measurable, reportable number.
Three immediate business outcomes drive the practice:
- Competitive gaps: SOV surfaces the specific keyword clusters where competitors outrank your client, giving you a prioritized list of opportunities rather than a vague sense of “we need more content.”
- Prioritization: Not all keywords carry equal weight. SOV weighted by search volume and CTR tells you which gaps cost the most traffic and pipeline influence.
- Client reporting and proof of influence: SOV gives clients a single, defensible KPI that connects SEO work to market presence — far more persuasive than raw ranking tables.
One critical caveat: SOV is only as meaningful as the keyword universe it measures. Tie it to buyer-relevant queries across organic, paid, social, and AI discovery surfaces, and it becomes a leading indicator. Measure it against a bloated, intent-agnostic keyword list, and it becomes noise.
Key Takeaways
Agencies that measure SOV on buyer-intent keyword sets and tie shifts to pipeline signals consistently outperform those that track broad visibility scores without intent segmentation.
| Point | Details |
|---|---|
| Measure buyer-intent clusters | Lock SOV tracking to decision-stage and consideration-stage queries, not broad informational terms. |
| Weight by volume and CTR | Use estimated traffic share (volume × position CTR) for the most commercially meaningful SOV figure. |
| Tie SOV to pipeline signals | Map SOV gains in priority clusters to branded search lift, direct traffic, and demo requests over a 60–90 day lag. |
| Cover AI discovery surfaces | Track AI answer-engine citations alongside organic and paid SOV, especially for B2B and high-consideration services. |
| Serpview for multi-site agencies | Serpview consolidates GSC data across properties with up to 50,000 rows and pre-built SOV-friendly reports. |
Table of Contents
- Why agencies track keyword share of voice: what SOV actually measures
- How agencies calculate keyword SOV
- Why SOV matters to agencies as a business metric
- How agencies turn SOV insights into concrete workflows
- Which tools and data sources agencies use to track SOV
- How Serpview helps agencies measure and act on keyword SOV
- Interpreting SOV results: what 100% means and what a “good” share looks like
- How to report SOV to clients: visuals, cadence, and common pitfalls
- The commercial case for SOV that most agencies understate
- Serpview makes SOV tracking practical for multi-site agencies
- Sources
- FAQ
Why agencies track keyword share of voice: what SOV actually measures
Keyword share of voice in SEO is your brand’s percentage of total visibility within a defined keyword universe and competitive set, typically weighted by search volume or estimated click-through rate.
SOV is not the same as market share, though long-standing marketing research ties excess SOV to future market share gains. It also differs from raw keyword rankings (position-only) and from search visibility scores, which are often position-weighted but not volume-weighted. According to Nielsen, SOV is a multi-channel measure of brand presence that adapts across discovery surfaces.
The key distinctions worth keeping clear:
- SOV vs. visibility score: Visibility scores weight by position only; SOV weights by both position and search volume (or estimated CTR), making it more commercially meaningful.
- SOV vs. share of search: Share of search typically uses branded query volume as a proxy for market share; SOV covers the full keyword universe, branded and non-branded.
- Channel coverage: Organic search, paid search (impression share), social mentions, earned media, and AI answer-engine citations each represent a distinct SOV surface. The metric’s lineage runs from paid media to organic and social, and now extends to AI-driven answer engines.
How agencies calculate keyword SOV
The formula looks simple, but the choices underneath it determine whether two agencies measuring the same client report the same number. According to CrawlSense, three main calculation variants exist:
- Volume × position-CTR (estimated traffic share): Multiply each keyword’s search volume by the CTR associated with your client’s ranking position, sum across the keyword set, then divide by the total estimated traffic available. This is the most commercially meaningful approach.
- Position-only visibility points: Assign a score to each position (e.g., position 1 = 100 points, position 10 = 10 points), sum your client’s scores, and divide by the maximum possible. Faster to compute, but ignores volume differences between keywords.
- Impression-based (paid): For paid SOV, use Google Ads impression share directly — your client’s impressions divided by total eligible impressions.
Worked example (3 keywords, organic SOV):
Client’s estimated traffic: 400 + 420 + 24 = 844.
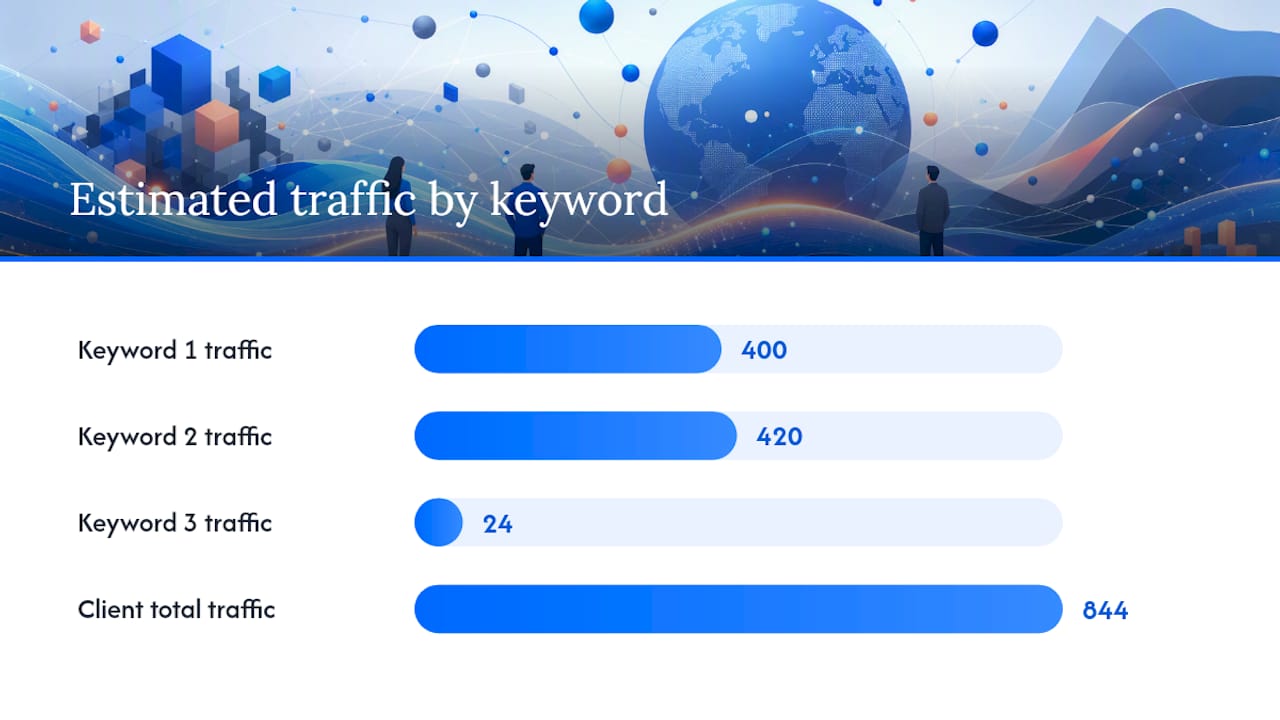
Swap the CTR model or add five more competitors, and that number shifts. HubSpot notes that tool differences in keyword set size, CTR model, and data coverage explain most of the divergence agencies see between platforms.
Keyword universe discipline matters as much as the formula. A fixed, locked keyword set lets you compare month-over-month with confidence. A dynamic set that expands as you discover new terms inflates apparent SOV gains and makes trend lines meaningless. Lock the universe at the start of each measurement period, document it, and only revise it at a defined review cadence.
Pro Tip: *Use Google Trends to validate that your tracked keywords still carry meaningful search interest before each reporting cycle.
Why SOV matters to agencies as a business metric
SOV earns its place in agency workflows because it connects SEO activity to outcomes that clients and finance teams actually care about.
- Competitive benchmarking: SOV shows not just where your client ranks, but how much of the available buyer attention they capture relative to named competitors. That framing resonates in boardrooms in a way that “we moved from position 6 to position 4” does not.
- Content and product prioritization: A cluster where your client holds 12% SOV against a competitor at 45% is a clear content investment signal. SOV turns a long keyword list into a prioritized gap analysis. Pair it with keyword opportunity reporting to build a defensible content roadmap.
- Paid-media planning: When organic SOV drops in a high-value cluster, paid impression share can fill the gap while content catches up. Tracking both together gives you a full-channel view of buyer-intent coverage.
- Client reporting and retainer defense: SOV gives you a KPI that moves at a pace clients can see quarter over quarter. Agencies that report SOV alongside pipeline metrics are harder to replace because the link between their work and commercial outcomes is explicit.
100signals argues that agencies should treat SOV as a sales signal, measuring visibility across buyer-relevant surfaces to influence shortlist and pipeline outcomes. That framing also shortens outbound sales cycles: an agency that can show a prospect their current SOV gap versus the category leader has a concrete, credible opening for a new engagement.
SOV becomes a vanity metric only when the keyword universe is misaligned. Broad, informational queries inflate the number without predicting pipeline. Buyer-intent clusters, even narrow ones, are where SOV earns its keep. Search performance tied to revenue depends on measuring the right queries, not the most queries.

How agencies turn SOV insights into concrete workflows
Measuring SOV is the easy part. Acting on it is where most agencies stall. A repeatable workflow closes that gap.
- Define the keyword universe by buyer intent: segment into awareness, consideration, and decision-stage clusters. Lock the set and document the date.
- Set SOV targets by cluster: bottom-funnel clusters warrant higher targets (aim for 30%+ in a competitive niche) than top-funnel awareness terms.
- Schedule monitoring and alerts: weekly checks for high-priority clusters, monthly for the full universe. A drop of more than 5 percentage points in a priority cluster should trigger an immediate root-cause audit — check for ranking losses, new competitor pages, or algorithm updates using custom annotations to correlate timing.
- Prioritize content and paid actions: clusters with the largest SOV gap and highest buyer intent get content investment first. Where a gap is too large to close organically in the short term, increase paid impression share to maintain presence.
- Validate via branded search and pipeline signals: SOV gains in buyer-intent clusters should precede lifts in branded keyword searches and direct traffic. Map those leading indicators to demo requests and closed deals over a 60–90 day lag window.
100signals frames this well: the goal is to convert an SOV change into a concrete commercial hypothesis. An increase in SOV in a decision-stage cluster is a testable prediction that pipeline velocity will improve in the following period.
Which tools and data sources agencies use to track SOV
No single tool covers every SOV surface. Agencies typically combine two or three sources to get a complete picture.
- Google Search Console (GSC): The most reliable source for organic query-level data, but limited to 1,000 rows per export and siloed by property. Use it for ground-truth validation of ranking and impression data. Addressing common search data blind spots requires going beyond GSC’s default limits.
- Commercial SOV and visibility trackers: — Platforms like Keyword.com and BrightEdge track keyword rankings and estimated visibility at scale across large keyword sets. They apply their own CTR models, which is why their SOV numbers often differ from GSC-derived figures.
- Social monitoring platforms: — Tools like Talkwalker measure brand mentions and social SOV across platforms. Social SOV inputs differ from search-based SOV — Hootsuite defines social SOV as brand presence in platform conversations, valuable for reputation and earned visibility tracking.
- Google Ads impression share: — The native paid SOV metric. Your client’s impressions divided by total eligible impressions, available directly in Google Ads. Combine with organic SOV for full-channel buyer-intent coverage.
The practical combination for most agency programs is to use GSC for query-level validation, alongside a commercial tracker for scaled ranking and visibility data, and a social monitoring tool for earned coverage. The keyword set should be locked in the commercial tracker and reconciled against GSC data regularly.
Pro Tip: SaaS SEO programs benefit from tracking SOV across both organic and AI surfaces early, because category-defining terms in SaaS tend to get absorbed into AI answer summaries faster than in other verticals.
How Serpview helps agencies measure and act on keyword SOV
Serpview addresses the most common SOV measurement pain point directly: Google Search Console’s 1,000-row export limit means agencies managing multi-site clients lose visibility into the long tail of queries that often contain the highest buyer-intent signals. Serpview consolidates GSC data across multiple properties into a single dashboard and raises the export ceiling to 50,000 rows, giving you the full query picture without manual stitching.
Key capabilities relevant to SOV tracking:
- Cross-property consolidation: Compare keyword performance across all client domains in one view, segmented by device, country, and date range.
- Historical performance tracking: Detect SOV trends over extended periods, not just the 16-month GSC window. Historical data analysis is what separates a trend from a one-month anomaly.
- Pre-built SOV-friendly reports: CTR benchmarking, keyword cluster analysis, content decay heatmaps, and cannibalization reports all feed directly into SOV interpretation.
- White-label client dashboards: Share live SOV data with clients through branded shared dashboards without exporting spreadsheets.
A typical agency scenario: a team notices a 7-point SOV drop in a client’s “enterprise software pricing” cluster over six weeks. Using Serpview’s exportable raw data, they identify three competitor pages that gained positions 2–4 during an algorithm update. They cross-reference the CTR benchmarks, confirm the traffic loss, and build a content-plus-paid response plan. Branded search queries for the client’s name recover within eight weeks of the fix.
Pro Tip: Export Serpview’s raw query data and use it to reconcile your SOV calculations against your commercial tracker’s figures. When the numbers diverge, the difference usually points to a CTR model assumption worth documenting for client transparency.

Interpreting SOV results: what 100% means and what a “good” share looks like
In practice, it signals category monopoly for those specific terms — possible in a very narrow niche, rare in any competitive market. The more useful question is what percentage is meaningful given the market’s concentration and the keyword set’s buyer intent.
Practical benchmarks:
- Bottom-funnel, buyer-intent clusters: Even 15–20% SOV in a well-defined decision-stage cluster can represent strong commercial presence if the cluster maps to high-value queries with low total search volume.
- Broad, awareness-stage clusters: 30% SOV sounds impressive but may deliver little pipeline if the queries are informational and the searchers are months from a purchase decision.
- Relative delta over absolute number: A client moving from 9% to 17% SOV in a priority cluster over two quarters is a stronger signal than a client sitting at 35% with no movement.
The guidance from WARC’s research on market share growth supports this framing: excess SOV relative to current market share predicts future share gains. So the target is not a fixed percentage — it is consistent growth in buyer-intent clusters where the client is currently underrepresented.
Weight your interpretation by intent, not just by size.
How to report SOV to clients: visuals, cadence, and common pitfalls
SOV reporting fails when it presents numbers without context. The goal is a report that drives a decision, not one that fills a slide.
What to include:
- Stacked area chart by competitor share over a locked keyword universe, showing how the competitive landscape has shifted over the reporting period.
- Trend lines for buyer-intent clusters separately from broad SOV, so clients see the metrics that actually predict pipeline.
- Alert callouts for sudden shifts (more than 5 percentage points in a priority cluster) with a brief root-cause note.
- Conversion overlay: tie SOV delta in buyer-intent clusters to demo requests, form fills, or branded search lift over the same period.
- Report template elements: defined keyword universe, calculation method, time window, top winning and losing clusters, and a clear recommended next action with an owner and deadline.
Common pitfalls to avoid:
- Mixing SOV data from two tools without aligning their keyword sets and CTR models — the numbers will contradict each other and erode client trust.
- Expanding the keyword universe mid-period to capture new opportunities, which inflates apparent SOV gains and breaks trend comparability.
- Reporting sitewide SOV without intent segmentation, which buries the signal in noise. Zero-click queries further complicate sitewide numbers, since impressions without clicks still count toward SOV but deliver no traffic.
PR and communications teams face the same discipline challenge. PR Daily notes that data-driven SOV is increasingly used to quantify earned coverage and compare it to paid efforts — a cross-team use case agencies should flag when clients have both PR and SEO programs running.
The commercial case for SOV that most agencies understate
The agencies that get the most out of SOV measurement are the ones that connect it to a commercial hypothesis before they start tracking, not after. You are reporting on pipeline risk. That framing changes how clients prioritize budget and how they evaluate your work.
SOV data made that choice obvious rather than debatable.
Serpview makes SOV tracking practical for multi-site agencies
Tracking SOV across multiple client properties means consolidating data that Google Search Console fragments by default. Serpview removes that friction by pulling up to 50,000 rows of GSC data across all your properties into one place, with pre-built reports for keyword clusters, CTR benchmarking, and content decay. You get the raw data to run your own SOV calculations and the client-ready dashboards to report them without building everything from scratch.

White-label sharing means clients see a branded dashboard, not a spreadsheet. Historical tracking means you can show a 12-month SOV trend, not just last month’s snapshot. If you are managing SOV reporting for more than two clients and still stitching together GSC exports manually, start with Serpview’s free tools to see how much of that work disappears.
Sources
- Nielsen: What is share of voice?
- HubSpot: Share of voice tools for growing companies
- KeywordTool: Share of voice
FAQ
What does 100% share of voice mean?
It signals category monopoly for those specific terms and is rare outside very narrow niches.
What is share of voice tracking?
Share of voice tracking is the ongoing measurement of your brand’s percentage of total visibility within a defined keyword universe, compared to a set of competitors, across one or more channels such as organic search, paid search, or social.
What is the purpose of share of voice in SEO?
SOV translates keyword rankings into a competitive market-presence metric. It helps agencies identify gaps, prioritize content investment, and report visibility progress in terms that connect to pipeline and revenue.
What is a good share of voice percentage?
There is no universal benchmark. Prioritize relative growth in buyer-intent clusters over absolute sitewide percentages.
Why do different tools report different SOV numbers for the same client?
Tool differences in keyword set size, CTR model, and data coverage cause most of the divergence. Pick one tool and one locked keyword universe for consistent benchmarking, then use a second source like Google Search Console for validation.
Recommended
Ready to unlock your full GSC potential?
SERPView helps you access all your Google Search Console data without limitations. Start your free trial today.
Get Started Free